kWh/MD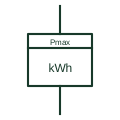
Energy meter with maximum-demand indicator
Energy meter that also records the highest average power over a fixed demand interval for demand charging.
SLD / Schematic
Indicating instrument with a resettable pointer or register showing the highest averaged current or power reached.
In plain English
A maximum-demand indicator shows the highest averaged load reached since it was last reset. Thermal demand ammeters with a drag pointer were common on switchboard feeders and transformer secondaries, and they help assess loading without a full recording instrument.
Thermal types respond with a time constant rather than a fixed interval, so their readings are not directly comparable with tariff demand meters. The symbol does not show the response time or reset method, both of which affect how the reading is used.
Check the response time or demand interval. Note when the indicator was last reset. A maximum-demand indicator shows only the peak averaged value; a maximum-demand meter also totalises energy.
Indicating instrument with a resettable pointer or register showing the highest averaged current or power reached. A maximum-demand indicator shows only the peak averaged value; a maximum-demand meter also totalises energy.
Read the source: IEC graphical symbols for diagrams
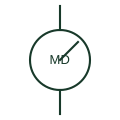
A maximum-demand indicator shows the highest averaged load reached since it was last reset. Thermal demand ammeters with a drag pointer were common on switchboard feeders and transformer secondaries, and they help assess loading without a full recording instrument.
Thermal types respond with a time constant rather than a fixed interval, so their readings are not directly comparable with tariff demand meters. The symbol does not show the response time or reset method, both of which affect how the reading is used.
A maximum-demand indicator shows only the peak averaged value; a maximum-demand meter also totalises energy.
These public references support the explanation and provide further detail. Their graphics and downloadable files remain with their publishers.
IEC context for graphical symbols used in diagrams; no IEC graphic is reproduced.
This illustration was authored independently by Elora Grid to explain the concept. It is not reproduced from a customer drawing, an official standard graphic or a manufacturer CAD file. Its correspondence to an exact IEC or IEEE symbol identifier has not been certified.
SVG and DXF downloads contain this original artwork. DXF uses unscaled drawing units; a GA envelope supplies no product dimensions, clearances or fabrication information. Original artwork is available under CC BY 4.0. Third-party references retain their own terms.
Energy meter that also records the highest average power over a fixed demand interval for demand charging.
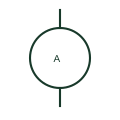
An ammeter indicates current from a direct or instrument-transformed measurement circuit.
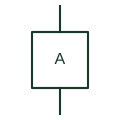
Recording instrument that keeps a time record of current, drawn as a square marked A.
Elora Grid helps electrical teams work with drawings, specifications and equipment information. Explore the drafting workflow or join the early-access waitlist.