MD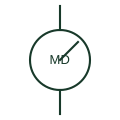
Maximum-demand indicator
Indicating instrument with a resettable pointer or register showing the highest averaged current or power reached.
SLD / Schematic
Energy meter that also records the highest average power over a fixed demand interval for demand charging.
In plain English
This meter totalises energy and also keeps the maximum average power reached in any demand interval, such as 15 or 30 minutes. Large supplies are often billed partly on that maximum demand, so the meter form appears on the supply single-line diagram with the demand interval stated nearby.
The demand register is reset periodically, usually at the end of a billing period. The symbol does not show the interval, whether it uses fixed blocks or a sliding window, or how reset is performed, and those settings change the recorded value.
Find the demand interval and window type. Check how and when the demand register is reset. A maximum-demand meter records peak averaged power plus energy; a maximum-demand indicator shows only the peak value.
Energy meter that also records the highest average power over a fixed demand interval for demand charging. A maximum-demand meter records peak averaged power plus energy; a maximum-demand indicator shows only the peak value.
Read the source: Power and energy measurement quantities · PowerLogic ION9000 user manual
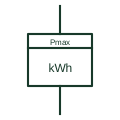
This meter totalises energy and also keeps the maximum average power reached in any demand interval, such as 15 or 30 minutes. Large supplies are often billed partly on that maximum demand, so the meter form appears on the supply single-line diagram with the demand interval stated nearby.
The demand register is reset periodically, usually at the end of a billing period. The symbol does not show the interval, whether it uses fixed blocks or a sliding window, or how reset is performed, and those settings change the recorded value.
A maximum-demand meter records peak averaged power plus energy; a maximum-demand indicator shows only the peak value.
These public references support the explanation and provide further detail. Their graphics and downloadable files remain with their publishers.
Public explanation of energy and power measurement quantities used by meters.
Public meter manual describing measurement, logging and recording features of a revenue and power-quality meter.
This illustration was authored independently by Elora Grid to explain the concept. It is not reproduced from a customer drawing, an official standard graphic or a manufacturer CAD file. Its correspondence to an exact IEC or IEEE symbol identifier has not been certified.
SVG and DXF downloads contain this original artwork. DXF uses unscaled drawing units; a GA envelope supplies no product dimensions, clearances or fabrication information. Original artwork is available under CC BY 4.0. Third-party references retain their own terms.
Indicating instrument with a resettable pointer or register showing the highest averaged current or power reached.
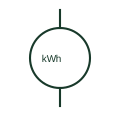
An active-energy meter accumulates active power over time.
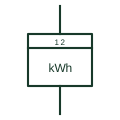
Energy meter that switches between registers by time or tariff signal so energy is billed at different rates.
Elora Grid helps electrical teams work with drawings, specifications and equipment information. Explore the drafting workflow or join the early-access waitlist.