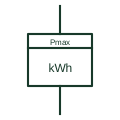
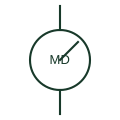
Understand the difference. Compare the meaning, drawing context and source references of two entries. A similar graphic or shared abbreviation does not establish equivalence.
First referenceCurrent transformer · CT Voltage transformer · VT / PT Circuit breaker · CB Disconnector · Isolator Load-break switch · LBS Earthing switch · ES Fuse · FU Busbar · Bus Normally open contact · NO Normally closed contact · NC Changeover contact · CO Relay coil · Coil Contactor · KM Normally open pushbutton · PB NO Normally closed pushbutton · PB NC Emergency-stop operator · E-stop Selector switch · SS Indicator lamp · Lamp Terminal connection · Terminal CT test terminal · CT test Power transformer · TX Generator · GEN Three-phase motor · M PLC input / output · PLC I/O Capacitor · C Resistor · R Protective earth · PE Battery · BAT Power converter / inverter · PCS Single-pole circuit breaker · CB 1P Thermal circuit breaker · CB TH Thermal-magnetic circuit breaker · CB TM Current-limiting circuit breaker · CB LIM Residual-current circuit breaker · RCCB Residual-current breaker with overcurrent protection · RCBO Circuit breaker with undervoltage release · CB UV Circuit breaker with electronic trip unit · CB ETU Miniature circuit breaker · MCB Moulded-case circuit breaker · MCCB Air circuit breaker · ACB Additional circuit-breaker pole · CB POLE Switch-disconnector · SD Lockable disconnector · DS LOCK Lockable switch-disconnector · SD LOCK Three-position disconnector · DS 3POS Semiconductor power switch · SSW Unidirectional semiconductor power switch · SSW UNI Two-pole power switch · SW 2P Disconnector auxiliary NO contact · DS AUX NO Disconnector auxiliary NC contact · DS AUX NC Fused switch · SW FUSE Fuse-switch · FUSE SW Additional fused-switch pole · FUSE POLE General-purpose full-range fuse · gG Motor short-circuit fuse · aM Motor full-range fuse · gM Current transformer with two secondaries · CT 2SEC Tapped-secondary current transformer · CT TAP Current transformer with primary conductor indication · CT PRI Core-balance current transformer · CBCT Residual connection of phase CTs · CT RES Single-phase two-winding transformer · TX 1PH Electrostatically screened transformer · TX SCREEN Three-winding transformer · TX 3W Adjustable-ratio transformer · TX ADJ Single-phase autotransformer · AT 1PH Three-phase star autotransformer · AT 3PH Y Star-delta transformer · TX Y-D Delta-star transformer · TX D-Y Delta-delta transformer · TX D-D Star-star transformer · TX Y-Y Star-zigzag transformer · TX Y-Z Star-star-delta three-winding transformer · TX Y-Y-D Delta winding connection · DELTA Open-delta winding connection · OPEN D Star winding connection · STAR Y Star winding with accessible neutral · Y N Zigzag winding connection · ZIGZAG Mechanically latched relay coil · K LATCH Relay reset coil · K RESET Solid-state relay · SSR Polarised relay coil · K POL AC relay coil · K AC High-speed relay · K FAST Measuring relay · K MEAS Relay coil with diode suppression · K DIODE Relay coil with diode and LED · K D LED Relay coil with capacitor suppression · K CAP Relay coil with RC suppression · K RC Counter relay with manual reset · COUNT MAN Counter relay with electrical reset · COUNT ELEC Non-resettable counter relay · COUNT TOTAL On-delay timer relay · TON Off-delay timer relay · TOFF On-delay normally-open contact · TON NO On-delay normally-closed contact · TON NC Off-delay normally-open contact · TOFF NO Off-delay normally-closed contact · TOFF NC Maintained normally-open contact · NO HOLD Maintained normally-closed contact · NC HOLD Manually unlatched NO contact · NO UNLATCH Manually unlatched NC contact · NC UNLATCH Early-make normally-open contact · NO EARLY Late-make normally-open contact · NO LATE Early-break normally-closed contact · NC EARLY Late-break normally-closed contact · NC LATE Make-before-break changeover contact · MBB Motor overload trip NC contact · OL NC Motor overload alarm NO contact · OL NO Illuminated normally-open pushbutton · PB NO LAMP Illuminated normally-closed pushbutton · PB NC LAMP Maintained normally-open pushbutton · PB NO HOLD Maintained normally-closed pushbutton · PB NC HOLD Key-operated normally-open switch · KEY NO Key-operated normally-closed switch · KEY NC Latched key-operated switch · KEY HOLD Pull-cord switch · PULL CORD Foot-operated switch · FOOT Lever-operated switch · LEVER Three-position maintained selector · SEL 3 HOLD Three-position selector returning from left · SEL 3 LRET Three-position selector returning from right · SEL 3 RRET Three-position centre-return selector · SEL 3 CRET Three-position key selector · KEY SEL 3 Four-position maintained selector · SEL 4 HOLD Four-position key selector · KEY SEL 4 Normally-open limit switch · LS NO Normally-closed limit switch · LS NC Roller-operated limit switch · LS ROLLER Cam-operated limit switch · LS CAM Pressure switch NO · PS NO Pressure switch NC · PS NC Temperature switch NO · TS NO Temperature switch NC · TS NC Self-operating thermal switch · TS SELF Float level switch NO · LS FLOAT NO Float level switch NC · LS FLOAT NC Liquid flow switch · FS LIQ Gas flow switch · FS GAS Inductive proximity switch · PROX IND Three-wire inductive proximity switch · PROX IND 3W Capacitive proximity switch · PROX CAP Magnetic proximity switch · PROX MAG Photoelectric emitter-receiver switch · PHOTO Thermocouple · TC Resistance temperature detector · RTD Voltmeter · V Ammeter · A Power-factor meter · PF Phase-angle meter · PHASE Frequency meter · Hz Temperature indicator · TEMP Tachometer · RPM Running-hours meter · HOURS Ampere-hour meter · Ah Recording wattmeter · W REC Reactive-power meter · var Synchronoscope · SYNC SCOPE Active-power indicator · kW Differential voltmeter · DELTA V Active-energy meter · kWh Reactive-energy meter · kvarh Maximum-current monitoring relay · I HIGH Minimum-current monitoring relay · I LOW Current window monitoring relay · I WINDOW Differential-current measuring relay · I DIFF Residual-voltage monitoring relay · U RES Loss-of-voltage monitoring relay · U LOSS Phase-loss monitoring relay · PH LOSS Frequency monitoring relay · f MON Minimum active-power relay · P LOW Feed-through terminal block · TB FEED Disconnect terminal block · TB DISC Knife-disconnect terminal · TB KNIFE Fuse terminal block · TB FUSE Diode terminal block · TB DIODE Component terminal block · TB COMP Multilevel terminal block · TB LEVEL Multi-conductor terminal block · TB MULTI Protective-earth terminal block · TB PE Sensor terminal block · TB SENSOR Actuator terminal block · TB ACT Plug-in terminal block · TB PLUG High-current terminal block · TB POWER Terminal jumper bridge · TB BRIDGE Plug and socket connector pair · PLUG SOCKET Connector plug half · PLUG Connector socket half · SOCKET Wire splice · SPLICE Earth connection · EARTH Functional earth · FE Protective equipotential bonding · BOND PE Functional equipotential bonding · BOND FE Surge arrester · SA Gas-discharge protection tube · GDT Spark-gap protective element · SPARK GAP Variable resistor · R VAR Potentiometer · POT Light-dependent resistor · LDR Heating element · HEATER RC network · RC Varistor · VDR Current-measuring shunt · SHUNT Electrolytic capacitor · C ELEC Feedthrough capacitor · C FEED Adjustable capacitor · C ADJ Three-phase power-factor capacitor · CAP 3PH Reactor · L Iron-core reactor · L IRON Gapped-core inductor · L GAP Adjustable-core inductor · L ADJ Diode · D Photodiode · PD Zener diode · ZD DIAC · DIAC Single-phase bridge rectifier · BR 1PH Three-phase bridge rectifier · BR 3PH Silicon-controlled rectifier · SCR Gate-turn-off thyristor · GTO TRIAC · TRIAC Bidirectional breakdown diode · TVS BI Single-phase AC motor · M 1PH AC Single-phase motor with fan · M 1PH FAN Three-phase AC motor · M 3PH Three-phase motor with fan · M 3PH FAN Wound-rotor induction motor · M WR Three-phase synchronous motor · M 3PH SYNC DC motor · M DC Permanent-magnet DC motor · M DC PM Series-excited DC motor · M DC SERIES Separately excited DC motor · M DC SEP DC generator · G DC Compound-excited DC generator · G DC COMP Three-phase synchronous generator · G 3PH SYNC Permanent-magnet synchronous generator · G 3PH PM AC-to-DC power supply · PSU AC-DC DC-to-DC converter · DC-DC DC-to-AC inverter · INV DC-AC DC uninterruptible power supply · UPS DC AC uninterruptible power supply · UPS AC Capacitor buffer module · BUFFER CAP Redundant power-supply decoupling module · PSU RED Analog current signal isolator · ISO I-I Temperature measuring transducer · TEMP TX Photovoltaic inverter · PV INV Single-phase AC source · AC 1PH Three-phase AC source · AC 3PH Photovoltaic generator · PV GEN Solar generating station · SOLAR STN Wind generating station · WIND STN Substation · SUBSTATION Converter substation · CONV STN Generic electrical load · LOAD Transformer-fed indicator lamp · LAMP TX Push-to-test indicator lamp · LAMP TEST LED indicator lamp · LAMP LED Flashing indicator lamp · LAMP FLASH Flashing beacon · BEACON FLASH Rotating beacon · BEACON ROT PLC digital input · DI PLC relay output · DO RELAY PLC transistor output · DO TRANS PLC analog input · AI PLC analog output · AO PLC temperature input · TI Capacitor voltage transformer · CVT / CCVT ANSI/IEEE circuit breaker symbol · CB ANSI/IEEE thermal circuit breaker symbol · CB TH ANSI/IEEE thermal-magnetic circuit breaker symbol · CB TM ANSI/IEEE current-limiting circuit breaker symbol · CB LIM ANSI/IEEE circuit breaker with undervoltage release symbol · CB UV ANSI/IEEE circuit breaker with electronic trip unit symbol · CB ETU ANSI/IEEE disconnector symbol · Isolator ANSI/IEEE switch-disconnector symbol · SD ANSI/IEEE lockable disconnector symbol · DS LOCK ANSI/IEEE lockable switch-disconnector symbol · SD LOCK ANSI/IEEE fused switch symbol · SW FUSE ANSI/IEEE fuse symbol · FU ANSI/IEEE fuse-switch symbol · FUSE SW ANSI/IEEE current transformer symbol · CT ANSI/IEEE current transformer with two secondaries symbol · CT 2SEC ANSI/IEEE tapped-secondary current transformer symbol · CT TAP ANSI/IEEE voltage transformer symbol · VT / PT ANSI/IEEE power transformer symbol · TX ANSI/IEEE electrostatically screened transformer symbol · TX SCREEN ANSI/IEEE three-winding transformer symbol · TX 3W ANSI/IEEE adjustable-ratio transformer symbol · TX ADJ ANSI/IEEE single-phase autotransformer symbol · AT 1PH ANSI/IEEE reactor symbol · L ANSI/IEEE iron-core reactor symbol · L IRON ANSI/IEEE gapped-core inductor symbol · L GAP ANSI/IEEE adjustable-core inductor symbol · L ADJ ANSI/IEEE normally open contact symbol · NO ANSI/IEEE normally closed contact symbol · NC ANSI/IEEE changeover contact symbol · CO ANSI/IEEE relay coil symbol · Coil ANSI/IEEE mechanically latched relay coil symbol · K LATCH ANSI/IEEE relay reset coil symbol · K RESET ANSI/IEEE polarised relay coil symbol · K POL ANSI/IEEE ac relay coil symbol · K AC ANSI/IEEE relay coil with diode suppression symbol · K DIODE ANSI/IEEE relay coil with rc suppression symbol · K RC ANSI/IEEE on-delay timer relay symbol · TON ANSI/IEEE off-delay timer relay symbol · TOFF ANSI/IEEE maintained normally-open contact symbol · NO HOLD ANSI/IEEE maintained normally-closed contact symbol · NC HOLD ANSI/IEEE early-make normally-open contact symbol · NO EARLY ANSI/IEEE late-make normally-open contact symbol · NO LATE ANSI/IEEE early-break normally-closed contact symbol · NC EARLY ANSI/IEEE late-break normally-closed contact symbol · NC LATE ANSI/IEEE motor overload trip nc contact symbol · OL NC ANSI/IEEE motor overload alarm no contact symbol · OL NO ANSI/IEEE normally open pushbutton symbol · PB NO ANSI/IEEE normally closed pushbutton symbol · PB NC ANSI/IEEE illuminated normally-open pushbutton symbol · PB NO LAMP ANSI/IEEE illuminated normally-closed pushbutton symbol · PB NC LAMP ANSI/IEEE maintained normally-open pushbutton symbol · PB NO HOLD ANSI/IEEE maintained normally-closed pushbutton symbol · PB NC HOLD ANSI/IEEE selector switch symbol · SS ANSI/IEEE three-position maintained selector symbol · SEL 3 HOLD ANSI/IEEE three-position centre-return selector symbol · SEL 3 CRET ANSI/IEEE three-position key selector symbol · KEY SEL 3 ANSI/IEEE four-position maintained selector symbol · SEL 4 HOLD ANSI/IEEE four-position key selector symbol · KEY SEL 4 ANSI/IEEE normally-open limit switch symbol · LS NO ANSI/IEEE normally-closed limit switch symbol · LS NC ANSI/IEEE roller-operated limit switch symbol · LS ROLLER ANSI/IEEE pressure switch no symbol · PS NO ANSI/IEEE pressure switch nc symbol · PS NC ANSI/IEEE temperature switch no symbol · TS NO ANSI/IEEE temperature switch nc symbol · TS NC ANSI/IEEE float level switch no symbol · LS FLOAT NO ANSI/IEEE float level switch nc symbol · LS FLOAT NC ANSI/IEEE liquid flow switch symbol · FS LIQ ANSI/IEEE terminal connection symbol · Terminal ANSI/IEEE numbered terminal symbol · TERM 1 ANSI/IEEE plug and socket connector pair symbol · PLUG SOCKET ANSI/IEEE connector plug half symbol · PLUG ANSI/IEEE connector socket half symbol · SOCKET ANSI/IEEE wire splice symbol · SPLICE ANSI/IEEE protective earth symbol · PE ANSI/IEEE functional earth symbol · FE ANSI/IEEE resistor symbol · R ANSI/IEEE variable resistor symbol · R VAR ANSI/IEEE potentiometer symbol · POT ANSI/IEEE light-dependent resistor symbol · LDR ANSI/IEEE heating element symbol · HEATER ANSI/IEEE varistor symbol · VDR ANSI/IEEE current-measuring shunt symbol · SHUNT ANSI/IEEE capacitor symbol · C ANSI/IEEE electrolytic capacitor symbol · C ELEC ANSI/IEEE feedthrough capacitor symbol · C FEED ANSI/IEEE adjustable capacitor symbol · C ADJ ANSI/IEEE diode symbol · D ANSI/IEEE photodiode symbol · PD ANSI/IEEE zener diode symbol · ZD ANSI/IEEE single-phase bridge rectifier symbol · BR 1PH ANSI/IEEE silicon-controlled rectifier symbol · SCR ANSI/IEEE triac symbol · TRIAC ANSI/IEEE voltmeter symbol · V ANSI/IEEE ammeter symbol · A ANSI/IEEE power-factor meter symbol · PF ANSI/IEEE frequency meter symbol · Hz ANSI/IEEE recording wattmeter symbol · W REC ANSI/IEEE reactive-power meter symbol · var ANSI/IEEE synchronoscope symbol · SYNC SCOPE ANSI/IEEE running-hours meter symbol · HOURS ANSI/IEEE single-phase ac motor symbol · M 1PH AC ANSI/IEEE three-phase ac motor symbol · M 3PH ANSI/IEEE wound-rotor induction motor symbol · M WR ANSI/IEEE dc motor symbol · M DC ANSI/IEEE permanent-magnet dc motor symbol · M DC PM ANSI/IEEE three-phase synchronous generator symbol · G 3PH SYNC ANSI/IEEE dc generator symbol · G DC ANSI/IEEE indicator lamp symbol · Lamp ANSI/IEEE transformer-fed indicator lamp symbol · LAMP TX ANSI/IEEE push-to-test indicator lamp symbol · LAMP TEST ANSI/IEEE led indicator lamp symbol · LAMP LED ANSI/IEEE on-delay normally-open contact symbol · TON NO ANSI/IEEE on-delay normally-closed contact symbol · TON NC ANSI/IEEE off-delay normally-open contact symbol · TOFF NO ANSI/IEEE off-delay normally-closed contact symbol · TOFF NC Positive-operation direction qualifier · Q070109 Manual-operation qualifier · Q021301 Protected-access manual-operation qualifier · Q021302 Pushbutton-operation qualifier · Q021305 Emergency-operation qualifier · Q021308 Rotary-operation qualifier · Q021304 Key-operation qualifier · Q021313 Foot-operation qualifier · Q021310 Lever-operation qualifier · Q021311 Crank-operation qualifier · Q021214 Handwheel-operation qualifier · Q021309 Liquid-level actuation qualifier · Q021401 Event-count actuation qualifier · Q021402 Liquid-flow actuation qualifier · Q021403 Gas-flow actuation qualifier · Q021404 Motor-operation qualifier · Q021326 Timed-operation qualifier · Q021327 Roller-operation qualifier · Q021315 Cam-operation qualifier · Q021316 Cam-profile indication · Q021317 Switch-position function qualifier · Q070106 Isolation-function qualifier · Q070103 Switch-disconnector function qualifier · Q070104 Circuit-breaker function qualifier · Q070102 Power-contactor function qualifier · Q070101 Automatic-trip qualifier · Q070105 Spring-return qualifier · Q070107 Maintained-position qualifier · Q070108 One-way linear-motion qualifier · Q020401R Two-way linear-motion qualifier · Q020402 Transition indication · Q101101 One-way rotary-motion qualifier · Q020403 Two-way rotary-motion qualifier · Q020404 Limited two-way rotary-motion qualifier · Q020405 Unidirectional propagation qualifier · Q020501 Simultaneous bidirectional propagation qualifier · Q020502 Alternating bidirectional propagation qualifier · Q020503 Signal-transmission qualifier · Q020504 Signal-reception qualifier · Q020505 Outbound-energy-flow qualifier · Q020506 Inbound-energy-flow qualifier · Q020507 Bidirectional-energy-flow qualifier · Q020508 Thermal-effect qualifier · Q020801 Magnetic-effect qualifier · Q020802 Magnetostrictive-effect qualifier · Q020803 Magnetic-field-effect qualifier · Q020804 Non-ionising radiation qualifier · Q020901 Ionising-radiation qualifier · Q020903 Presumed-fault-location indication · Q021701 Insulation-failure indication · Q021702 Two-phase winding connection · Q060201 Partial-V winding connection · Q060202 Four-phase winding with accessible connection · Q060203 Three-phase T winding connection · Q060204 Six-phase double-delta winding connection · Q060210 Six-phase polygon winding connection · Q060211 Six-phase star winding connection · Q060212 Six-phase double-zigzag winding connection · Q060213 Direct-current supply qualifier · Q020201 Alternating-current supply qualifier · Q020204 Rectified-current with AC component qualifier · Q020212 Automatic mechanical-return indication · Q021207 Mechanical stop-latch indication · Q021208 Mechanical stop latch in neutral state · Q021209 Mechanical stop latch in engaged state · Q021210 Mechanical interlock between devices · Q021211 Two-way latching device · Q1020603 Manually released latching device · Q1020604 Key-controlled two-way latching device · Q1029603 Mechanical clutch connection · Q021216 Disconnected mechanical coupling · Q021217 Engaged mechanical coupling · Q021218 Mechanical gear connection · Q021223 Thermocouple with terminal board · HTC1LTB Pyrometer indication · HIN1P25 Clock indication · HIN1P29 Minute-pulse clock contact · HIN1P33 Pressure-to-current converter · HIN1B10 Single-phase AC-to-DC current converter · HIN1G1 Tachometric dynamo · HIN1B11 Impulse tachometric transducer · HIN1B12 Optical tachometric transducer · HIN1B13 Audible bell · HAN1B Audible buzzer · HAN1Z Audible siren · HAN1S Loudspeaker annunciation · HAN1B7 Combined loudspeaker and microphone · HAN1B8 Microphone input · HAN1B9 Solenoid valve actuator · HSV1 Solenoid closing function for an open valve · HSV1Y1 Electromagnetic brake actuator · HSV1Y4 Solenoid-valve NO auxiliary contact · HSV21 Solenoid-valve NC auxiliary contact · HSV22 Ultrasonic proximity switch · HPX1U Ultrasonic NO switching output · HPX11U Ultrasonic NC switching output · HPX12U Three-wire ultrasonic sensor · HPX11U3 Touch-sensitive switch · HPX1TS Touch-switch NO output · HPX11TS Touch-switch NC output · HPX12TS Three-wire touch-sensitive switch · HPX11TS3 Phase-to-phase voltmeter selector · HSW1S90 Phase-to-neutral voltmeter selector · HSW1S91 Combined line and phase voltmeter selector · HSW1S92 Two-network voltage measurement selector · HSW1S93 Three-point current measurement selector · HSW1S94 Four-point current measurement selector · HSW1S95 Latched pull-cord switch · HPC11L Latched foot-operated switch · HFT11L Latched lever-operated switch · HPB11LSL Three-phase motor with four connections · HMO14 Three-phase induction motor with series excitation · HMO1M3 Star-stator wound-rotor motor with rotor starter · HMO1M5 Six-pole asynchronous motor · HMO1M11 Single-phase series-connected AC motor · HMO1M10 Single-phase synchronous motor · HMO1M16 Permanent-magnet linear DC motor · HMO1M14 Permanent-magnet stepping motor · HMO1M15 Shunt-excited DC motor · HMO1M8 Resistor with disconnecting slider · HVR1R5 Carbon-disc variable resistor · HVR1R8 Magnetoresistive element · HVR1S00689 Differential capacitor · HCA1_S00573 Preset-adjustable capacitor · HCA1_S00575 Split adjustable capacitor · HCA1_S00579 Cable identification marker · HW01 Additional cable-core marker · HW02 Twisted-pair indication · HT0_TW Single power receptacle · HCN1RSGL Duplex power receptacle · HCN1RDUP Generic device boundary · HDV1T6 Standalone source cross-reference · HA2S1_REF Standalone destination cross-reference · HA2D1_REF Reference-only wire arrow · HA1X1 One-line connector representation · HC01PJ_1- One-line terminal representation · HT0001_1- One-line cable identification · HW01_1- One-line bus tap · HDV1_BT_1- One-line power receptacle · HC01WR_1- Connector retaining wire identity · HC01PJ Connector changing wire identity · HCN1PJ Terminal carrying wire identification · HT0W02 Terminal with wire-number transition · HT1002 Conductor connection junction · JUNCTION Unconnected conductor crossing · CROSSING Three-phase conductor group · 3~ Dy5 transformer connection reference · Dy5 Dd6 transformer connection reference · Dd6 Yd5 transformer connection reference · Yd5 Yy6 transformer connection reference · Yy6 Yd11 transformer connection reference · Yd11 Dy11 transformer connection reference · Dy11 Dz0 transformer connection reference · Dz0 Yz5 transformer connection reference · Yz5 Dz6 transformer connection reference · Dz6 Yz11 transformer connection reference · Yz11 Schottky diode · SBD Unidirectional TVS diode · TVS Light-emitting diode · LED Varactor diode · VAR PIN diode · PIN NPN bipolar transistor · NPN PNP bipolar transistor · PNP NPN Darlington transistor · NPN-DAR PNP Darlington transistor · PNP-DAR N-channel JFET · N-JFET P-channel JFET · P-JFET N-channel enhancement MOSFET · N-MOS P-channel enhancement MOSFET · P-MOS N-channel depletion MOSFET · N-DMOS Insulated-gate bipolar transistor · IGBT MOSFET body diode · BODY-D GaN enhancement-mode HEMT · E-HEMT Integrated gate-commutated thyristor · IGCT NPN phototransistor · PHOTO-NPN Phototransistor optocoupler · OPTO-TR Photodiode optocoupler · OPTO-PD Phototriac optocoupler · OPTO-TRIAC Photovoltaic MOSFET driver · PV-DRV Capacitive digital isolator · DIG-ISO Isolated gate driver · ISO-GD Low-side gate driver · LS-GD High-side gate driver · HS-GD Bootstrap gate-drive supply · BOOT Ideal-diode controller · IDEAL-D Hot-swap controller · HOT-SWAP Electronic fuse IC · EFUSE Half-bridge power module · HB-MOD Three-phase sixpack power module · 6-PACK AND gate · AND OR gate · OR NAND gate · NAND NOR gate · NOR Exclusive-OR gate · XOR Exclusive-NOR gate · XNOR Logic inverter · NOT Non-inverting logic buffer · BUF Three-state logic buffer · 3STATE Schmitt-trigger inverter · SCHMITT-NOT Schmitt-trigger buffer · SCHMITT Positive-edge D flip-flop · D-FF Negative-edge JK flip-flop · JK-FF Set-reset latch · SR-LATCH Transparent D latch · D-LATCH Serial-in parallel-out register · SIPO Parallel-in serial-out register · PISO Shift register with output latch · SHIFT-LATCH Ripple binary counter · CTR-RIP Synchronous binary counter · CTR-SYNC Decoded decade counter · DECADE Retriggerable monostable · ONE-SHOT Binary decoder / demultiplexer · DEC Priority encoder · ENC-PRI Digital multiplexer · MUX Digital magnitude comparator · MAG-COMP Binary full adder · ADD Logic bus transceiver · BUS-TR Logic voltage-level translator · LEVEL Open-collector buffer · OC-BUF Parity generator / checker · PARITY Phase-locked loop · PLL Voltage-controlled oscillator · VCO Clock generator · CLK-GEN Watchdog timer · WDT Operational amplifier · OP-AMP Voltage comparator · COMP Instrumentation amplifier · INA Difference amplifier · DIFF-AMP Fully differential amplifier · FDA Current-sense amplifier · CSA Isolation amplifier · ISO-AMP Operational transconductance amplifier · OTA Analogue multiplier · MULT Analogue bilateral switch · A-SW Analogue multiplexer · A-MUX Sample-and-hold amplifier · S/H Analogue-to-digital converter · ADC Digital-to-analogue converter · DAC Series voltage reference · VREF-S Shunt voltage reference · VREF-H Precision rectifier · PREC-RECT RMS-to-DC converter · RMS-DC Voltage / frequency converter · V/F Inverting amplifier circuit · INV-AMP Non-inverting amplifier circuit · NI-AMP Op-amp integrator · INTEGRATOR Op-amp differentiator · DIFFERENTIATOR Active low-pass filter · LPF Active high-pass filter · HPF Active band-pass filter · BPF Active notch filter · NOTCH Transimpedance amplifier · TIA Buck converter topology · BUCK Boost converter topology · BOOST Inverting buck-boost topology · INV-BB Four-switch buck-boost topology · 4SW-BB SEPIC converter topology · SEPIC Cuk converter topology · CUK Zeta converter topology · ZETA Flyback converter topology · FLYBACK Forward converter topology · FORWARD Active-clamp forward topology · ACF Push-pull converter topology · PUSH-PULL Half-bridge DC converter topology · HB-DC Full-bridge DC converter topology · FB-DC Phase-shifted full-bridge topology · PSFB LLC resonant converter topology · LLC Dual-active-bridge topology · DAB Single-phase voltage-source inverter · 1PH-VSI Three-phase voltage-source inverter · 3PH-VSI Neutral-point-clamped inverter · NPC Active front-end rectifier · AFE Battery fuel gauge · SoC Battery charger controller · CHG Battery protection controller · BPROT Battery cell voltage monitor · CELL V Passive battery cell balancer · BAL R Active battery cell balancer · BAL X Battery cell temperature monitor · CELL T Battery pack monitor · PACK Battery precharge circuit · PRE Battery insulation monitoring function · IMD Battery pack current measurement · PACK I AC electric vehicle charge point · AC EV EV control pilot interface · CP EV charging residual-current detection · RCD EV EV charging contactor control · EV K DC electric vehicle charging station · DC EV Bidirectional EV charging interface · V2G EV charger power module · EV PWR EV charging energy measurement · EV kWh Photovoltaic module · PV MOD Photovoltaic string · PV STR Photovoltaic string combiner · COMB MPPT solar charge controller · MPPT Photovoltaic power optimiser · PV OPT Photovoltaic rapid shutdown function · RSD Photovoltaic arc-fault detection · PV AFD CAN bus transceiver · CAN CAN FD transceiver · CAN FD LIN bus transceiver · LIN RS-485 transceiver · RS485 RS-422 interface · RS422 RS-232 transceiver · RS232 Ethernet physical-layer transceiver · PHY Single-pair Ethernet interface · SPE PoE powered-device interface · PoE PD PoE power-sourcing interface · PoE PSE I2C bus buffer · I2C BUF I2C voltage-level translator · I2C LVL SPI interface buffer · SPI BUF LVDS line driver · LVDS TX LVDS line receiver · LVDS RX Magnetic digital isolator · ISO MAG Isolated comparator · ISO CMP Isolated CAN transceiver · ISO CAN Isolated RS-485 transceiver · ISO 485 Isolated I2C interface · ISO I2C Isolated analogue-to-digital converter · ISO ADC Power-source multiplexer · PWR MUX Reverse-polarity protection controller · REV POL Integrated load switch · LOAD SW Smart high-side switch · HS SW Low-side power switch · LS SW Linear voltage regulator · LIN REG Low-dropout voltage regulator · LDO Supply voltage supervisor · SVS Power-good indication · PG Window voltage supervisor · V WIN Power-rail sequencer · SEQ Power-rail enable interface · EN Hall-effect current sensor · HALL I Magnetic position sensor · MAG POS Inductive position sensor · IND POS Ultrasonic distance sensor · US DIST Radar level sensing function · RAD LVL Pressure measurement interface · P MEAS Capacitive level sensor · CAP LVL Relative humidity sensor · RH Flexible conductor · W Screened conductor · W Screened multi-conductor cable · W Screened conductor with earthed screen · W Screened twisted pair · W Coaxial cable · W Coaxial cable with earthed outer conductor · W Conductor in conduit · W Overhead line · OHL Underground cable · UGC Underwater cable · SC Optical fibre cable · OF Conductors within one cable · W Conductor count by numeral · n Neutral conductor mark · N Protective conductor mark · PE PEN conductor mark · PEN Three-phase circuit with neutral and PE marking · 3/N/PE Interchange of conductors · X Conductor branching from a group · W T-connection without junction dot · - Double junction of conductors · - ANSI/IEEE conductor junction symbol · - ANSI/IEEE crossing conductor hop symbol · - ANSI/IEEE shielded conductor symbol · W ANSI/IEEE coaxial cable symbol · W ANSI/IEEE twisted pair symbol · TW ANSI/IEEE multi-conductor cable symbol · W Single-core cable sealing end · SE Multicore cable sealing end · SE Cable straight-through joint · J Cable branch joint · J Cable transition joint · J Separable cable connector · X Sealed cable end · W ANSI/IEEE cable pothead symbol · PH Feeder busway · BD Plug-in busway · BD Busway tap-off connection · TO Busway end feed unit · EF Power distribution block · X Multi-pole plug and socket · X Coaxial plug and socket · X Fibre-optic connector · X Inline cable coupler · X Connector with protective earth contact · X Plug and jack with common pin number · X Additional connector pin · X ANSI/IEEE coaxial connector symbol · J Neutral link, closed · N Neutral link, open · N Bolted connecting link, closed · X Bolted connecting link, open · X Removable earth test link · E Neutral-to-earth link · MEN ANSI/IEEE terminal jumper symbol · JMP ANSI/IEEE main bonding jumper symbol · MBJ Flexible bonding strap · BS Frame or chassis connection · - ANSI/IEEE chassis ground symbol · - Noiseless earth · - Earth electrode · E Earth grid conductor · EG Earth electrode with inspection pit · E Lightning protection down-conductor · DC Lightning air termination · AT Lightning protection test joint · TJ Main earthing terminal · MET ANSI/IEEE earth connection symbol · - ANSI/IEEE protective equipotential bonding symbol · - ANSI/IEEE functional equipotential bonding symbol · - Direct neutral earthing connection · - Cable screen cross-bonding · CB ANSI/IEEE surge arrester symbol · SA ANSI/IEEE spark gap symbol · SG ANSI/IEEE gas discharge tube symbol · GDT Double spark gap · F Symmetric gas discharge tube · F ANSI/IEEE terminal with wire number symbol · TB ANSI/IEEE terminal with wire number change symbol · TB Socket outlet with protective earth contact · SO Switched socket outlet · SSO Socket outlet with interlocked switch · SOI Three-phase socket outlet · SO3 Weatherproof socket outlet · SO-IP Shaver supply unit · SSU Multiple socket outlet · SOn RCD-protected socket outlet · SO-RCD Fused connection unit plan mark · FCU Flex outlet plate · FO Cooker control unit · CCU Floor box outlet · FB ANSI single receptacle outlet plan symbol · R ANSI duplex receptacle outlet plan symbol · DR ANSI GFCI duplex receptacle plan symbol · GFCI ANSI weatherproof receptacle plan symbol · WP ANSI special-purpose outlet plan symbol · SP One-way light switch plan mark · S1 Two-pole one-way switch plan mark · S2P Two-way light switch plan mark · S2W Intermediate light switch plan mark · SI Dimmer switch plan mark · SD Ceiling pull-cord switch plan mark · SPC Time-delay push switch plan mark · ST Push button plan mark · PB Switch with pilot light plan mark · SPL Lighting presence detector plan mark · PIR-L Photoelectric light switch plan mark · PE ANSI single-pole switch plan symbol · S ANSI three-way switch plan symbol · S3 ANSI four-way switch plan symbol · S4 ANSI dimmer switch plan symbol · SD Distribution board plan mark · DB ANSI panelboard plan symbol · PNL Junction box plan mark · JB Local isolator plan mark · ISO Ceiling fan plan mark · CF Extract fan plan mark · EF Electric space heater plan mark · HTR Water heater plan mark · WH Room thermostat plan mark · TS Time switch plan mark · TSW Luminaire general plan symbol · L Wall-mounted luminaire plan mark · LW Linear fluorescent luminaire plan mark · LF Multi-tube fluorescent luminaire plan mark · LF3 Recessed downlight plan mark · DL Spotlight plan mark · SPT Floodlight plan mark · FL Maintained emergency luminaire plan mark · EM-M Non-maintained emergency luminaire plan mark · EM-NM Exit sign luminaire plan mark · EXIT Lighting track plan mark · TRK Pole-mounted luminaire plan mark · LP ANSI ceiling lighting outlet plan symbol · LO ANSI wall lighting outlet plan symbol · LOW ANSI exit light outlet plan symbol · X Smoke detector plan symbol · SD Fixed-temperature heat detector plan symbol · HD Rate-of-rise heat detector plan symbol · HD-R Multi-sensor fire detector plan symbol · MSD Optical beam smoke detector plan symbol · BD Flame detector plan symbol · FD Duct smoke detector plan symbol · DSD Manual call point plan symbol · MCP Fire alarm sounder plan symbol · SNDR Combined sounder and visual alarm device plan symbol · SVAD Fire alarm control panel plan symbol · FACP Magnetic door holder plan symbol · DH Firefighter telephone outlet plan symbol · FFT ANSI smoke detector plan symbol · SD ANSI manual fire alarm station plan symbol · F ANSI fire alarm horn-strobe plan symbol · HS Intruder motion detector plan symbol · PIR Door contact plan symbol · DC CCTV camera plan symbol · CAM Data outlet plan symbol · DO Telephone outlet plan symbol · TO Telephone set symbol · TEL Television outlet plan symbol · TV Antenna symbol · ANT Dish antenna symbol · SAT Fibre-optic link symbol · FO Media converter symbol · MC Network switch symbol · SW Network router symbol · RTR Firewall symbol · FW Wireless access point symbol · WAP Server symbol · SRV Door intercom station symbol · IC IEC AND gate (rectangular form) · & IEC OR gate (rectangular form) · ≥1 IEC NAND gate (rectangular form) · & IEC NOR gate (rectangular form) · ≥1 IEC exclusive-OR gate (rectangular form) · =1 IEC exclusive-NOR gate (rectangular form) · =1 IEC NOT element (rectangular form) · 1 IEC buffer element (rectangular form) · 1 IEC three-state buffer (rectangular form) · EN IEC Schmitt-trigger buffer (rectangular form) · 1 IEC Schmitt-trigger inverter (rectangular form) · 1 IEC open-collector buffer (rectangular form) · 1 IEC logic identity element · = IEC even-parity element · 2k IEC odd-parity element · 2k+1 IEC AND-OR-invert element · AOI IEC common-output element · COE ANSI three-input AND gate · AND3 ANSI four-input NAND gate · NAND4 ANSI three-input OR gate · OR3 ANSI three-input NOR gate · NOR3 ANSI AND-OR-invert gate · AOI ANSI NAND gate drawn as negative-input OR · NAND ANSI NOR gate drawn as negative-input AND · NOR ANSI open-collector inverter · OC-NOT ANSI wired-AND connection · WIRED-AND ANSI three-state inverter with active-low enable · OE ANSI Schmitt-trigger NAND gate · NAND-ST ANSI inhibit gate (AND with one negated input) · INH IEC logic negation at input · NEG-IN IEC logic negation at output · NEG-OUT IEC polarity indicator at input (active-low input) · POL-IN IEC polarity indicator at output (active-low output) · POL-OUT IEC dynamic input (edge-triggered) · DYN IEC dynamic input with negation (falling edge) · DYN-NEG IEC postponed output qualifier · POSTPONED IEC open-circuit output, L-type (open collector) · OC-L IEC open-circuit output, H-type (open emitter) · OC-H IEC three-state output qualifier · 3S IEC hysteresis (bi-threshold) qualifier · HYST IEC enable input (EN) · EN IEC common-control block · CCB IEC AND dependency (G) · Gm IEC OR dependency (V) · Vm IEC negate dependency (N) · Nm IEC control dependency (C) · Cm IEC mode dependency (M) · Mm IEC interconnection dependency (Z) · Zm IEC address dependency (A) · Am IEC set and reset dependency (S, R) · Sm/Rm IEC D flip-flop (rectangular form) · 1D IEC JK flip-flop (rectangular form) · 1J 1K IEC SR latch (rectangular form) · S R IEC transparent D latch (rectangular form) · C1 1D IEC T (toggle) flip-flop · 1T IEC pulse-triggered (master-slave) JK flip-flop · 1J 1K IEC clocked SR flip-flop · 1S 1R IEC non-retriggerable monostable · 1⊓ IEC retriggerable monostable · ⊓ IEC astable element · G ANSI cross-coupled NAND latch · S̄R̄ ANSI cross-coupled NOR latch · SR IEC synchronous binary counter (CTRm) · CTR4 IEC ripple counter (RCTRm) · RCTR IEC decade counter (CTR DIV10) · CTR DIV10 IEC up/down counter · CTR +/- IEC shift register (SRGm) · SRG8 IEC bidirectional (universal) shift register · SRG4 IEC multiplexer (MUX) · MUX IEC binary decoder (X/Y coder) · BIN/OCT IEC priority encoder (HPRI/BIN) · HPRI/BIN IEC BCD-to-seven-segment decoder · BCD/7SEG IEC general code converter (X/Y) · X/Y IEC magnitude comparator (COMP) · COMP IEC adder (Σ) · Σ IEC arithmetic logic unit (ALU) · ALU IEC read-only memory (ROM) · ROM IEC random-access memory (RAM) · RAM IEC first-in first-out memory (FIFO) · FIFO IEC operational amplifier (rectangular form) · ▷∞ IEC summing amplifier element (Σ) · Σ IEC integrator element (∫) · ∫ IEC differentiator element (d/dt) · d/dt IEC analogue multiplier element · Π IEC sample-and-hold element · S/H ANSI operational amplifier (triangle form) · OA Op-amp voltage follower · BUF Op-amp comparator with hysteresis · COMP-H IEC subtracter (P-Q) · P-Q IEC look-ahead carry generator (CPG) · CPG ANSI/IEEE phase-angle meter symbol · PH ANSI/IEEE thermometer symbol · T ANSI/IEEE tachometer symbol · TACH ANSI/IEEE ampere-hour meter symbol · Ah ANSI/IEEE thermocouple symbol · TC ANSI/IEEE thermocouple with terminal board symbol · TC ANSI/IEEE active power indicator symbol · W ANSI/IEEE thermometer/pyrometer symbol · PYR ANSI/IEEE differential voltmeter symbol · ΔV ANSI/IEEE pressure/current converter symbol · P/I ANSI/IEEE single-phase AC-DC current converter symbol · I~/I= ANSI/IEEE tachometric dynamo symbol · TG ANSI/IEEE impulse tachometric dynamo symbol · TP ANSI/IEEE optical tachometric dynamo symbol · TO ANSI/IEEE current transformer with conductor indication symbol · CT Reverse-current measuring relay · K Percentage-biased differential current relay · K Neutral-current measuring relay · K Neutral-unbalance relay between two polyphase systems · K Earth-fault current relay · K Minimum-voltage measuring relay · K Maximum-voltage measuring relay · K Earth-fault voltage relay · K Minimum-impedance measuring relay · K Insulation monitoring relay · IMD Indicating instrument general symbol · * Recording instrument general symbol · * Integrating instrument general symbol · * Ohmmeter · Ω Insulation resistance meter · MΩ Galvanometer · G Oscilloscope · OSC Recording voltmeter · V Recording ammeter · A Combined recording wattmeter and varmeter · W/var Apparent-energy meter · kVAh Bidirectional active-energy meter · kWh Multi-rate energy meter · kWh Energy meter with maximum-demand indicator · kWh/MD Excess-energy meter · kWh> Energy meter with pulse transmitter · kWh Energy meter repeater · kWh Prepayment energy meter · kWh Volt-squared-hour meter · V²h Summation energy meter · Σ kWh Maximum-demand indicator · MD Phase-sequence indicator · PSI Voltage presence indicating system · VPIS Double voltmeter · V V Double frequency meter · Hz Hz Multifunction power meter · PM Power quality analyser · PQ Disturbance recorder · DFR Sequence-of-events recorder · SOE Phasor measurement unit · PMU Active-power transducer · P/I Voltage measuring transducer · U/I Multi-core current transformer · CT Summation current transformer · ΣCT Interposing current transformer · ICT Rogowski coil current sensor · RC Wound-primary current transformer · CT Bushing current transformer · BCT Voltage transformer with two secondary windings · VT Voltage transformer set with broken-delta residual winding · VT Open-delta voltage transformer connection · VT Combined instrument transformer · CT/VT Resistive voltage divider sensor · RVD Low-power current transformer · LPCT Optical current sensor · OCT Numerical protection relay (IED) · IED Trip-circuit supervision relay · TCS Buchholz relay · BR Winding temperature indicator · WTI Thermistor motor protection relay · PTC Arc-flash point light sensor · AF Arc-flash fibre loop sensor · AF Residual current monitor · RCM Definite-time delay qualifier for measuring relays · t Inverse-time characteristic qualifier · IDMT Directional measuring element qualifier · → Relay test block · TB Test plug · TP Current test switch with shorting contact · TS Potential test switch · TS Synchronising lamps · SL Fault passage indicator · FPI Surge arrester counter · SC Vibration sensor · VS Partial discharge sensor · PD Fixed-speed wind turbine generator (Type 1) · WTG T1 Variable-slip wind turbine generator (Type 2) · WTG T2 Doubly-fed induction generator · DFIG Full-converter wind turbine generator (Type 4) · WTG T4 Three-phase induction generator · G 3~ ASG Single-phase synchronous generator · G 1~ Synchronous generator with brushless exciter · G 3~ BX ANSI/IEEE permanent-magnet synchronous generator symbol · PMG ANSI/IEEE compound-excited DC generator symbol · G DC CMP Diesel generator set · DG Gas engine generator set · GG Gas turbine generator · GTG Hydro turbine generator · HG Fuel cell · FC Hydrogen electrolyser · ELY Flywheel energy storage · FESS Supercapacitor bank · SC Single battery cell · GB cell Battery string · BS Battery rack · BR Battery energy storage system · BESS Centre-tapped battery bank · GB ± ANSI/IEEE battery symbol · BT Battery power conversion system · PCS Float and boost battery charger · BC Thyristor phase-controlled rectifier · SCR REC Twelve-pulse rectifier · 12P Grid-forming inverter · GFM Grid-following inverter · GFL Hybrid inverter · HYB INV Bidirectional inverter-charger · INV/CHG PV string inverter · INV STR PV central inverter · INV CTR PV microinverter · MI Bidirectional DC-to-DC converter · DC/DC BI Isolated DC-to-DC converter · DC/DC ISO Static frequency converter · SFC Motor-generator set · MG Static transfer switch · STS Automatic transfer switch · ATS Manual transfer switch · MTS Closed-transition transfer switch · CTTS Bypass-isolation transfer switch · BP/ATS Online double-conversion UPS · UPS VFI Line-interactive UPS · UPS VI Offline standby UPS · UPS VFD Rotary UPS · RUPS UPS maintenance bypass · MBP Static var compensator · SVC Thyristor-controlled reactor · TCR Thyristor-switched capacitor · TSC Static synchronous compensator · STATCOM Synchronous condenser · SC Single-tuned harmonic filter · HF Damped high-pass harmonic filter · HPF Active harmonic filter · AHF Detuned capacitor bank · DCB Dynamic voltage restorer · DVR Point of common coupling · PCC Utility grid connection · GRID Grid equivalent source · EQ SRC Microgrid interconnection switch · MIS Resistive load bank · LB Resistive-reactive load bank · LB RL Neutral earthing resistor · NER Arc suppression coil · ASC Microgrid controller · MGC Genset controller · GC Power plant controller · PPC Dump load controller · DLC Split-phase inverter · INV 2x120 IEC pushbutton contact: mushroom head normally open momentary · PB IEC pushbutton contact: mushroom head normally closed momentary · PB IEC pushbutton contact: mushroom head normally open latching · PB IEC pushbutton contact: mushroom head normally closed latching · PB IEC pushbutton contact: mushroom head normally open twist latch · PB IEC pushbutton contact: mushroom head normally closed twist latch · PB IEC pushbutton contact: mushroom head normally open latching, pull to disengage · PB IEC pushbutton contact: mushroom head normally closed latching, pull to disengage · PB IEC pushbutton contact: mushroom head normally open latching, key operated · PB IEC pushbutton contact: mushroom head normally closed latching, key operated · PB IEC pushbutton contact: normally open push button recessed · PB IEC pushbutton contact: normally closed push button recessed · PB IEC pushbutton contact: normally open push button recessed latched · PB IEC pushbutton contact: normally closed push button recessed latched · PB IEC pushbutton contact: normally open push button positive make · PB IEC pushbutton contact: normally closed push button positive break · PB IEC selector-switch contact: 2 position maintain, normally closed · SS IEC selector-switch contact: 2 position normally open return from left · SS IEC selector-switch contact: 2 position normally closed return from left · SS IEC selector-switch contact: 2 position normally open return from right · SS IEC selector-switch contact: 2 position normally closed return from right · SS IEC selector-switch contact: 2 position normally open with lamp · SS IEC selector-switch contact: 2 position normally closed with lamp · SS IEC selector-switch contact: normally open anticipated contact · SS IEC selector-switch contact: normally open delayed contact · SS IEC selector-switch contact: normally closed anticipated contact · SS IEC selector-switch contact: normally closed delayed contact · SS IEC selector-switch contact: 3 position maintain, normally closed · SS IEC selector-switch contact: 3 position normally closed return from left · SS IEC selector-switch contact: 3 position normally closed return from right · SS IEC selector-switch contact: 3 position normally closed return from both · SS IEC selector-switch contact: 3 position normally open neutral 0 · SS IEC selector-switch contact: 3 position normally closed neutral 0 · SS IEC selector-switch contact: 3 position normally open neutral 1 · SS IEC selector-switch contact: 3 position normally closed neutral 1 · SS IEC selector-switch contact: 3 position normally open neutral 2 · SS IEC selector-switch contact: 3 position normally closed neutral 2 · SS IEC selector-switch contact: 3 position normally closed key operated neutral 0 · SS IEC selector-switch contact: 3 position normally open key operated neutral 1 · SS IEC selector-switch contact: 3 position normally closed key operated neutral 1 · SS IEC selector-switch contact: 3 position normally open key operated neutral 2 · SS IEC selector-switch contact: 3 position normally closed key operated neutral 2 · SS IEC selector-switch contact: 3 stable position normally open key operated neutral 0 · SS IEC selector-switch contact: 3 stable position normally closed key operated neutral 0 · SS IEC selector-switch contact: 3 stable position normally open key operated neutral 1 · SS IEC selector-switch contact: 3 stable position normally closed key operated neutral 1 · SS IEC selector-switch contact: 3 stable position normally open key operated neutral 2 · SS IEC selector-switch contact: 3 stable position normally closed key operated neutral 2 · SS IEC selector-switch contact: 4 position maintain, normally closed · SS IEC selector-switch contact: 4 position key selector normally closed · SS IEC selector-switch contact: 4 stable positions key selector normally open · SS IEC selector-switch contact: 4 stable positions key selector normally closed · SS IEC selector-switch contact: 4 stable positions key selector normally open-rotating in 2 ways · SS IEC selector-switch contact: 4 stable positions key selector normally closed-rotating in 2 ways · SS IEC selector-switch contact: 4 stable positions key selector normally open-rotating clockwise · SS IEC selector-switch contact: 4 stable positions key selector normally closed-rotating clockwise · SS IEC protective circuit-breaker form: with current protection · CB IEC protective circuit-breaker form: with max. current and min. voltage protection · CB IEC protective circuit-breaker form: with max. thermal/current and min. voltage protection · CB IEC protective circuit-breaker form: with max. thermal and min. voltage protection · CB IEC protective circuit-breaker form: with max. thermal and current protection · CB IEC protective circuit-breaker form: with max. thermal protection and differential · CB IEC protective circuit-breaker form: 1 pole auto switch with magneto · CB IEC protective circuit-breaker form: 1 pole auto magneto-thermal switch/disconnect · CB IEC fused switching form: 1 phase disconnect with fuse · QS IEC fused switching form: 1 phase maneuver switch/disconnect with fuse · QS IEC fused switching form: maneuver switch with fuse · QS IEC fused switching form: power auto switch/disconnect · QS IEC timing-relay form: on/off delay · KT IEC timing-relay form: 3 clamp delay relay - energized · KT IEC timing-relay form: 3 clamp delay relay - de-energized · KT IEC timing-relay form: normally open contact (instant) · KT IEC timing-relay form: normally closed contact (instant) · KT IEC timing-relay form: normally open delay on/off · KT IEC timing-relay form: normally closed delay on/off · KT IEC motor-starter form: motor starter coil · KM IEC motor-starter form: motor starter 1 pole normally open (power) · KM IEC motor-starter form: motor starter 1 pole normally closed (power) · KM IEC mechanical position-switch contact: limit switch, roller normally closed · LS IEC mechanical position-switch contact: limit switch normally closed - cam driven · LS IEC mechanical position-switch contact: limit switch normally open - events driven · LS IEC mechanical position-switch contact: limit switch normally closed - events driven · LS IEC mechanical position-switch contact: 2 position switch normally open with detents and lamp · LS IEC mechanical position-switch contact: 2 position switch normally closed with detents and lamp · LS IEC mechanical position-switch contact: bi-directional lever actuated - normally open · LS IEC mechanical position-switch contact: bi-directional lever actuated - normally closed · LS IEC mechanical position-switch contact: four-directional lever actuated - normally open · LS IEC mechanical position-switch contact: four-directional lever actuated - normally closed · LS IEC mechanical position-switch contact: bi-directional lever actuated - normally open with detent · LS IEC mechanical position-switch contact: bi-directional lever actuated - normally closed with detent · LS IEC mechanical position-switch contact: four-directional lever actuated - normally open with detent · LS IEC mechanical position-switch contact: four-directional lever actuated - normally closed with detent · LS IEC inductive proximity sensor: ferrous proximity switch, normally open · IND IEC inductive proximity sensor: ferrous proximity switch, normally closed · IND IEC inductive proximity sensor: normally closed 3 wire · IND IEC inductive proximity sensor: normally open 3 wire with connector · IND IEC inductive proximity sensor: normally closed 3 wire with connector · IND IEC capacitive proximity sensor: capacitive switch, normally open · CAP IEC capacitive proximity sensor: capacitive switch, normally closed · CAP IEC capacitive proximity sensor: normally open 3 wire · CAP IEC capacitive proximity sensor: normally closed 3 wire · CAP IEC capacitive proximity sensor: normally open 3 wire with connector · CAP IEC capacitive proximity sensor: normally closed 3 wire with connector · CAP IEC magnetic proximity sensor: magnetic proximity switch, normally open · MAG IEC magnetic proximity sensor: magnetic proximity switch, normally closed · MAG IEC magnetic proximity sensor: normally open 3 wire · MAG IEC magnetic proximity sensor: normally closed 3 wire · MAG IEC magnetic proximity sensor: normally open 3 wire with connector · MAG IEC magnetic proximity sensor: normally closed 3 wire with connector · MAG IEC photoelectric emitter interface: emitter - AC driven · TX IEC photoelectric emitter interface: emitter - DC driven · TX IEC photoelectric emitter interface: emitter - receiver with form c · TX IEC photoelectric emitter interface: normally open 4 wire · TX IEC photoelectric emitter interface: normally closed 4 wire · TX IEC photoelectric emitter interface: normally open 4 wire with connector · TX IEC photoelectric emitter interface: normally closed 4 wire with connector · TX IEC photoelectric receiver: normally open receiver 2 wire · RX IEC photoelectric receiver: normally closed receiver 2 wire · RX IEC photoelectric receiver: normally open receiver 2 wire with connector · RX IEC photoelectric receiver: normally closed receiver 2 wire with connector · RX IEC photoelectric receiver: normally open receiver 3 wire · RX IEC photoelectric receiver: normally closed receiver 3 wire · RX IEC photoelectric receiver: normally open receiver 3 wire with connector · RX IEC photoelectric receiver: normally closed receiver 3 wire with connector · RX IEC photoelectric receiver: normally open receiver - AC driven · RX IEC photoelectric receiver: normally closed receiver - AC driven · RX IEC photoelectric receiver: normally open receiver - DC driven · RX IEC photoelectric receiver: normally closed receiver - DC driven · RX IEC combined photoelectric sensor: normally closed emitter-receiver - DC driven · TX IEC combined photoelectric sensor: normally open emitter-receiver AC/DC driven 2 pin · TX IEC combined photoelectric sensor: normally closed emitter-receiver AC/DC driven 2 pin · TX IEC combined photoelectric sensor: normally open emitter-receiver AC driven 3 pin · TX IEC combined photoelectric sensor: normally closed emitter-receiver AC driven 3 pin · TX IEC combined photoelectric sensor: normally open emitter-receiver DC driven 3 pin · TX IEC combined photoelectric sensor: normally closed emitter-receiver DC driven 3 pin · TX IEC combined photoelectric sensor: normally open emitter-receiver AC driven 4 pin · TX IEC combined photoelectric sensor: normally closed emitter-receiver AC driven 4 pin · TX IEC combined photoelectric sensor: normally open emitter-receiver DC driven 4 pin · TX IEC combined photoelectric sensor: normally closed emitter-receiver DC driven 4 pin · TX IEC combined photoelectric sensor: form c emitter-receiver AC driven 5 pin · TX IEC combined photoelectric sensor: form c emitter-receiver DC driven 5 pin · TX IEC ultrasonic proximity sensor: normally open 3 wire with connector · US IEC ultrasonic proximity sensor: normally closed 3 wire with connector · US IEC touch-sensitive sensor: normally open 3 wire with connector · TOUCH IEC touch-sensitive sensor: normally closed 3 wire with connector · TOUCH IEC PNP phototransistor: photosensitive pnp transistor · PNP PHOTO IEC backward diode: backward (unitunnel) diode · BACKWARD IEC tunnel diode: tunnel diode · TUNNEL IEC two-wire PLC point: in, 1st point, 2 wires · PLC IEC two-wire PLC point: out, 1st point, 2 wires · PLC ANSI/IEEE Residual-current breaker with overcurrent protection form · RCBO ANSI/IEEE Three-position disconnector form · DS 3POS ANSI/IEEE Semiconductor power switch form · SSW ANSI/IEEE Unidirectional semiconductor power switch form · SSW UNI ANSI/IEEE Two-pole power switch form · SW 2P ANSI/IEEE Three-phase star autotransformer form · AT 3PH Y ANSI/IEEE Star-delta transformer form · TX Y-D ANSI/IEEE Delta-star transformer form · TX D-Y ANSI/IEEE Delta-delta transformer form · TX D-D ANSI/IEEE Star-star transformer form · TX Y-Y ANSI/IEEE Star-zigzag transformer form · TX Y-Z ANSI/IEEE Star-star-delta three-winding transformer form · TX Y-Y-D ANSI/IEEE Solid-state relay form · SSR ANSI/IEEE High-speed relay form · K FAST ANSI/IEEE Measuring relay form · K MEAS ANSI/IEEE Relay coil with diode and LED form · K D LED ANSI/IEEE Relay coil with capacitor suppression form · K CAP ANSI/IEEE Counter relay with manual reset form · COUNT MAN ANSI/IEEE Counter relay with electrical reset form · COUNT ELEC ANSI/IEEE Non-resettable counter relay form · COUNT TOTAL ANSI/IEEE Manually unlatched NO contact form · NO UNLATCH ANSI/IEEE Manually unlatched NC contact form · NC UNLATCH ANSI/IEEE Make-before-break changeover contact form · MBB ANSI/IEEE Key-operated normally-open switch form · KEY NO ANSI/IEEE Key-operated normally-closed switch form · KEY NC ANSI/IEEE Latched key-operated switch form · KEY HOLD ANSI/IEEE Pull-cord switch form · PULL CORD ANSI/IEEE Foot-operated switch form · FOOT ANSI/IEEE Lever-operated switch form · LEVER ANSI/IEEE Three-position selector returning from left form · SEL 3 LRET ANSI/IEEE Three-position selector returning from right form · SEL 3 RRET ANSI/IEEE Cam-operated limit switch form · LS CAM ANSI/IEEE Self-operating thermal switch form · TS SELF ANSI/IEEE Gas flow switch form · FS GAS ANSI/IEEE Inductive proximity switch form · PROX IND ANSI/IEEE Three-wire inductive proximity switch form · PROX IND 3W ANSI/IEEE Capacitive proximity switch form · PROX CAP ANSI/IEEE Magnetic proximity switch form · PROX MAG ANSI/IEEE Photoelectric emitter-receiver switch form · PHOTO ANSI/IEEE Maximum-current monitoring relay form · I HIGH ANSI/IEEE Minimum-current monitoring relay form · I LOW ANSI/IEEE Current window monitoring relay form · I WINDOW ANSI/IEEE Differential-current measuring relay form · I DIFF ANSI/IEEE Residual-voltage monitoring relay form · U RES ANSI/IEEE Loss-of-voltage monitoring relay form · U LOSS ANSI/IEEE Phase-loss monitoring relay form · PH LOSS ANSI/IEEE Frequency monitoring relay form · f MON ANSI/IEEE Minimum active-power relay form · P LOW ANSI/IEEE RC network form · RC ANSI/IEEE Three-phase power-factor capacitor form · CAP 3PH ANSI/IEEE DIAC form · DIAC ANSI/IEEE Three-phase bridge rectifier form · BR 3PH ANSI/IEEE Bidirectional breakdown diode form · TVS BI ANSI/IEEE Single-phase motor with fan form · M 1PH FAN ANSI/IEEE Three-phase motor with fan form · M 3PH FAN ANSI/IEEE Three-phase synchronous motor form · M 3PH SYNC ANSI/IEEE Series-excited DC motor form · M DC SERIES ANSI/IEEE Separately excited DC motor form · M DC SEP ANSI/IEEE Single-phase AC source form · AC 1PH ANSI/IEEE Three-phase AC source form · AC 3PH ANSI/IEEE Photovoltaic generator form · PV GEN ANSI/IEEE Solar generating station form · SOLAR STN ANSI/IEEE Wind generating station form · WIND STN ANSI/IEEE Substation form · SUBSTATION ANSI/IEEE Converter substation form · CONV STN ANSI/IEEE Two-phase winding connection form · Q060201 ANSI/IEEE Partial-V winding connection form · Q060202 ANSI/IEEE Four-phase winding with accessible connection form · Q060203 ANSI/IEEE Three-phase T winding connection form · Q060204 ANSI/IEEE Six-phase double-delta winding connection form · Q060210 ANSI/IEEE Six-phase polygon winding connection form · Q060211 ANSI/IEEE Six-phase star winding connection form · Q060212 ANSI/IEEE Six-phase double-zigzag winding connection form · Q060213 ANSI/IEEE Automatic mechanical-return indication form · Q021207 ANSI/IEEE Mechanical stop-latch indication form · Q021208 ANSI/IEEE Mechanical stop latch in neutral state form · Q021209 ANSI/IEEE Mechanical stop latch in engaged state form · Q021210 ANSI/IEEE Mechanical interlock between devices form · Q021211 ANSI/IEEE Manually released latching device form · Q1020604 ANSI/IEEE Mechanical clutch connection form · Q021216 ANSI/IEEE Disconnected mechanical coupling form · Q021217 ANSI/IEEE Engaged mechanical coupling form · Q021218 ANSI/IEEE Mechanical gear connection form · Q021223 ANSI/IEEE Clock indication form · HIN1P29 ANSI/IEEE Minute-pulse clock contact form · HIN1P33 ANSI/IEEE Audible bell form · HAN1B ANSI/IEEE Audible buzzer form · HAN1Z ANSI/IEEE Audible siren form · HAN1S ANSI/IEEE Loudspeaker annunciation form · HAN1B7 ANSI/IEEE Combined loudspeaker and microphone form · HAN1B8 ANSI/IEEE Microphone input form · HAN1B9 ANSI/IEEE Solenoid valve actuator form · HSV1 ANSI/IEEE Solenoid closing function for an open valve form · HSV1Y1 ANSI/IEEE Electromagnetic brake actuator form · HSV1Y4 ANSI/IEEE Solenoid-valve NO auxiliary contact form · HSV21 ANSI/IEEE Solenoid-valve NC auxiliary contact form · HSV22 ANSI/IEEE Ultrasonic proximity switch form · HPX1U ANSI/IEEE Ultrasonic NO switching output form · HPX11U ANSI/IEEE Ultrasonic NC switching output form · HPX12U ANSI/IEEE Three-wire ultrasonic sensor form · HPX11U3 ANSI/IEEE Touch-sensitive switch form · HPX1TS ANSI/IEEE Touch-switch NO output form · HPX11TS ANSI/IEEE Touch-switch NC output form · HPX12TS ANSI/IEEE Three-wire touch-sensitive switch form · HPX11TS3 ANSI/IEEE Phase-to-phase voltmeter selector form · HSW1S90 ANSI/IEEE Phase-to-neutral voltmeter selector form · HSW1S91 ANSI/IEEE Combined line and phase voltmeter selector form · HSW1S92 ANSI/IEEE Two-network voltage measurement selector form · HSW1S93 ANSI/IEEE Three-point current measurement selector form · HSW1S94 ANSI/IEEE Four-point current measurement selector form · HSW1S95 ANSI/IEEE Latched pull-cord switch form · HPC11L ANSI/IEEE Latched foot-operated switch form · HFT11L ANSI/IEEE Latched lever-operated switch form · HPB11LSL ANSI/IEEE Three-phase motor with four connections form · HMO14 ANSI/IEEE Three-phase induction motor with series excitation form · HMO1M3 ANSI/IEEE Star-stator wound-rotor motor with rotor starter form · HMO1M5 ANSI/IEEE Six-pole asynchronous motor form · HMO1M11 ANSI/IEEE Single-phase series-connected AC motor form · HMO1M10 ANSI/IEEE Single-phase synchronous motor form · HMO1M16 ANSI/IEEE Permanent-magnet linear DC motor form · HMO1M14 ANSI/IEEE Permanent-magnet stepping motor form · HMO1M15 ANSI/IEEE Shunt-excited DC motor form · HMO1M8 ANSI/IEEE Resistor with disconnecting slider form · HVR1R5 ANSI/IEEE Carbon-disc variable resistor form · HVR1R8 ANSI/IEEE Magnetoresistive element form · HVR1S00689 ANSI/IEEE Differential capacitor form · HCA1_S00573 ANSI/IEEE Dy5 transformer connection reference form · Dy5 ANSI/IEEE Dd6 transformer connection reference form · Dd6 ANSI/IEEE Yd5 transformer connection reference form · Yd5 ANSI/IEEE Yy6 transformer connection reference form · Yy6 ANSI/IEEE Yd11 transformer connection reference form · Yd11 ANSI/IEEE Dy11 transformer connection reference form · Dy11 ANSI/IEEE Dz0 transformer connection reference form · Dz0 ANSI/IEEE Yz5 transformer connection reference form · Yz5 ANSI/IEEE Dz6 transformer connection reference form · Dz6 ANSI/IEEE Yz11 transformer connection reference form · Yz11 ANSI/IEEE Neutral link, closed form · N ANSI/IEEE Neutral link, open form · N ANSI/IEEE Double spark gap form · F ANSI/IEEE Symmetric gas discharge tube form · F ANSI/IEEE Reverse-current measuring relay form · K ANSI/IEEE Percentage-biased differential current relay form · K ANSI/IEEE Neutral-current measuring relay form · K ANSI/IEEE Neutral-unbalance relay between two polyphase systems form · K ANSI/IEEE Earth-fault current relay form · K ANSI/IEEE Minimum-voltage measuring relay form · K ANSI/IEEE Maximum-voltage measuring relay form · K ANSI/IEEE Earth-fault voltage relay form · K ANSI/IEEE Minimum-impedance measuring relay form · K ANSI/IEEE Insulation monitoring relay form · IMD Synchronism check · 25 Undervoltage · 27 Directional power · 32 Current unbalance / negative sequence · 46 Thermal protection · 49 Instantaneous overcurrent · 50 Time overcurrent · 51 AC circuit breaker · 52 Overvoltage · 59 Directional overcurrent · 67 AC autoreclosing · 79 Frequency protection · 81 Lockout · 86 Differential protection · 87 Line switch · 89 Master element · 1 Time-delay starting or closing relay · 2 Checking or interlocking relay · 3 Master contactor · 4 Stopping device · 5 Starting circuit breaker · 6 Rate-of-change relay · 7 Control power disconnecting device · 8 Reversing device · 9 Unit sequence switch · 10 Multifunction device · 11 Overspeed device · 12 Synchronous-speed device · 13 Underspeed device · 14 Speed or frequency matching device · 15 Data communications device · 16 Shunting or discharge switch · 17 Accelerating or decelerating device · 18 Starting-to-running transition contactor · 19 Electrically operated valve · 20 Distance protection · 21 Equalizer circuit breaker · 22 Temperature control device · 23 Overexcitation protection · 24 Apparatus thermal device · 26 Flame detector · 28 Isolating contactor · 29 Annunciator relay · 30 Separate excitation device · 31 Position switch · 33 Master sequence device · 34 Brush-operating or slip-ring short-circuiting device · 35 Polarity device · 36 Undercurrent or underpower protection · 37 Bearing protective device · 38 Mechanical condition monitor · 39 Field or loss-of-excitation protection · 40 Field circuit breaker · 41 Running circuit breaker · 42 Manual transfer or selector device · 43 Unit sequence starting relay · 44 Atmospheric condition monitor · 45 Phase-sequence or voltage-balance protection · 47 Incomplete-sequence relay · 48 Exciter or DC generator relay · 53 Turning-gear engaging device · 54 Power factor protection · 55 Field application relay · 56 Short-circuiting or grounding device · 57 Rectification failure relay · 58 Voltage or current balance relay · 60 Density switch or sensor · 61 Time-delay stopping or opening relay · 62 Pressure switch or relay · 63 Ground detector protection · 64 Governor · 65 Notching or jogging device · 66 Blocking or out-of-step supervision · 68 Permissive control device · 69 Rheostat · 70 Level switch or relay · 71 DC circuit breaker · 72 Load-resistor contactor · 73 Alarm relay · 74 Position-changing mechanism · 75 DC overcurrent relay · 76 Telemetering device · 77 Phase-angle or out-of-step protection · 78 Flow switch or relay · 80 DC load-measuring reclosing relay · 82 Automatic selective control or transfer relay · 83 Operating mechanism · 84 Pilot or carrier receiver relay · 85 Auxiliary motor or motor-generator · 88 Regulating device · 90 Voltage directional relay · 91 Voltage and power directional relay · 92 Field-changing contactor · 93 Tripping or trip-free relay · 94 Phase distance protection · 21P Ground distance protection · 21G Admittance-based earth-fault protection · 21YN Auxiliary-input undervoltage protection · 27A Main-input undervoltage protection · 27M Reactive-power undervoltage protection · 27Q Low-voltage ride-through supervision · 27T Wattmetric earth-fault protection · 32N Directional reactive-power protection · 32V Reverse-power protection · 32R Underpower protection · 32U Generator current-unbalance protection · 46G Phase-discontinuity protection · 46PD RTD-based thermal protection · 49R Motor thermal-model protection · 49M Instantaneous phase overcurrent · 50P Instantaneous neutral overcurrent · 50N Instantaneous ground overcurrent · 50G Instantaneous negative-sequence overcurrent · 50Q Calculated residual instantaneous overcurrent · 50R Measured ground instantaneous overcurrent · 50X Circuit-breaker failure protection · 50BF Motor jam or stall protection · 50J Time phase-overcurrent protection · 51P Time neutral-overcurrent protection · 51N Time ground-overcurrent protection · 51G Time negative-sequence overcurrent · 51Q Calculated residual time-overcurrent · 51R Measured ground time-overcurrent · 51X Voltage-dependent overcurrent · 51V Apparent power-factor supervision · 55A Displacement power-factor supervision · 55D Residual or neutral overvoltage · 59N Negative-sequence overvoltage · 59Q Auxiliary-input overvoltage · 59A Main-input overvoltage · 59M Field ground-fault protection · 64F Stator ground-fault protection · 64G Directional phase-overcurrent · 67P Directional neutral-overcurrent · 67N Directional ground-overcurrent · 67G Directional negative-sequence overcurrent · 67Q Calculated residual directional overcurrent · 67R Measured ground directional overcurrent · 67X Multifrequency admittance earth-fault protection · 67YN Transient or intermittent earth-fault protection · 67NIEF Trip-coil monitoring · 74TCM Voltage vector-shift protection · 78VS Underfrequency protection · 81U Overfrequency protection · 81O Rate-of-change-of-frequency protection · 81R Transformer differential protection · 87T Busbar differential protection · 87B Generator differential protection · 87G Motor differential protection · 87M Line current differential protection · 87L Neutral differential protection · 87N Negative-sequence differential protection · 87Q Restrained current differential protection · 87R Unrestrained high-set differential protection · 87H Restricted ground differential protection · 87GD Switchgear panel · Panel Switchboard · Board Ring main unit · RMU Transformer envelope · Transformer GA Battery storage cabinet · BESS cabinet Power conversion cabinet · PCS cabinet Generator package · Genset GA Transfer-switch assembly · ATS Control / marshalling cabinet · Control GA Cable ladder / tray · Cable support Busbar trunking · Busway Mounting plate · Plate Terminal strip assembly · Terminal strip Air circuit breaker · ACB Moulded-case circuit breaker · MCCB Miniature circuit breaker · MCB Residual-current circuit breaker · RCCB Residual-current breaker with overcurrent protection · RCBO DC circuit breaker · GA Motor-protection circuit breaker · MPCB Switch disconnector · GA Fuse-switch disconnector · GA Fuse holder · GA Power contactor · GA Reversing contactor assembly · GA Star-delta starter assembly · GA Thermal overload relay · GA Electronic motor overload relay · GA Soft starter · GA Variable-frequency drive · VFD Drive braking resistor · GA AC line reactor · GA Control transformer · GA Dry-type transformer enclosure · GA Oil-filled transformer installation · GA Neutral earthing resistor cabinet · NER Power-factor-correction capacitor bank · GA Active harmonic filter cabinet · GA Surge protective device assembly · SPD DIN-rail AC/DC power supply · GA DIN-rail DC/DC converter · DC DC redundancy module · GA DC buffer module · GA DC UPS module · GA Battery charger · DC AC UPS cabinet · GA UPS maintenance bypass panel · GA Station DC battery rack · GA PLC CPU module · GA PLC power module · GA Digital input module · GA Digital output module · GA Analogue input module · GA Analogue output module · GA Remote I/O station · GA HMI touchscreen · GA Industrial panel PC · GA Industrial Ethernet switch · GA Industrial VPN router · GA Fibre-optic patch panel · GA Communication gateway · GA Interface relay module · GA Relay socket · GA Timer relay · GA Safety relay module · GA Signal conditioner · GA Terminal marshalling interface · GA Feed-through terminal block · GA Protective-earth terminal block · GA Multi-level terminal block · GA Fuse terminal block · GA Disconnect terminal block · GA CT shorting test terminal · GA Distribution terminal block · GA Pluggable terminal connector · GA Terminal end stop · GA Terminal marker strip · GA DIN mounting rail · GA Slotted wiring duct · GA Cable gland · GA Cable-entry frame · GA Bulkhead connector · GA Cable cleat · GA Perforated cable tray · GA Wire-mesh cable basket · GA Cable-tray horizontal bend · GA Cable-tray vertical riser · GA Cable support bracket · GA Cable trench · GA Cable pit · GA Cable duct bank · GA Earth bar · GA Neutral bar · GA Flexible busbar connection · GA Rigid busbar assembly · GA Busbar support insulator · GA Busway tap-off unit · GA LV incomer compartment · GA LV feeder compartment · GA Bus-coupler compartment · GA Cable termination compartment · GA Busbar compartment · GA Metering compartment · GA Motor control centre lineup · GA Withdrawable motor feeder unit · GA MV vacuum circuit-breaker truck · GA Switchgear arc exhaust plenum · GA Protection relay panel · GA Panel power meter · GA Energy submeter · GA Window current transformer · GA Split-core current transformer · GA Voltage transformer assembly · VT Wall-mounted junction enclosure · GA Floor-standing enclosure · GA Enclosure plinth · GA Enclosure gland plate · GA Enclosure door swing envelope · GA Equipment maintenance envelope · GA Equipment removal route · GA Switchroom egress path · GA Enclosure anti-condensation heater · GA Enclosure thermostat · GA Enclosure hygrostat · GA Enclosure filter fan · GA Enclosure air conditioner · GA Enclosure air-to-air heat exchanger · GA Switchroom supply fan · GA Switchroom exhaust fan · GA Ventilation intake louver · GA Motorised ventilation damper · GA Backdraft damper · GA Fire damper · GA Smoke-control damper · GA Generator day tank · GA Generator bulk fuel tank · GA Generator fuel transfer pump · GA Generator fuel bund · GA Generator exhaust silencer · GA Generator exhaust flexible connection · GA Generator exhaust stack · GA Generator radiator discharge duct · GA Generator remote radiator · GA Generator vibration isolator · GA Generator acoustic canopy · GA Generator coolant heater · GA Generator starting battery · GA Generator paralleling controller · GA PV string combiner box · GA PV inverter cabinet · GA PV DC isolator enclosure · GA MPPT solar charge controller · GA Battery inverter-charger · GA Battery management system module · BMS Battery DC disconnect assembly · GA Battery precharge assembly · DC Battery DC bus distribution module · DC Battery current shunt · DC Energy-management controller · EMS Outdoor energy-storage container · GA Battery cooling unit · GA Battery fire-system interface panel · GA Smoke detector installation point · GA Fire alarm control panel location · GA Emergency stop station · GA Pilot-light station · GA Selector-switch station · GA Trapped-key interlock assembly · GA Door-mounted pushbutton enclosure · GA Panel service outlet · GA Panel inspection lighting · GA AutomationDirect BRX Series PLC · BRX Series PLC AutomationDirect CLICK PLCs · CLICK PLCs AutomationDirect Productivity1000 PAC · Productivity1000 PAC AutomationDirect Productivity2000 PAC · Productivity2000 PAC AutomationDirect Productivity3000 PAC · Productivity3000 PAC AutomationDirect Terminator Field I/O · Terminator Field I/O AutomationDirect Protos X Field I/O · Protos X Field I/O AutomationDirect ZIPLinks · ZIPLinks AutomationDirect DINnectors · DINnectors AutomationDirect Konnect-It DIN-rail terminals · Konnect-It DIN-rail terminals AutomationDirect C-more Panels · C-more Panels AutomationDirect C-more Micro Graphic Panels · C-more Micro Graphic Panels AutomationDirect GS and DURApulse AC drives · GS and DURApulse AC drives AutomationDirect LR Series line reactors · LR Series line reactors AutomationDirect Bimed cable glands · Bimed cable glands AutomationDirect ZIPport Multi-Wire Connectors · ZIPport Multi-Wire Connectors AutomationDirect ZIPport Panel Interface Connectors · ZIPport Panel Interface Connectors AutomationDirect Gladiator CFS disconnects · Gladiator CFS disconnects AutomationDirect WMZT miniature circuit breakers · WMZT miniature circuit breakers AutomationDirect Edison Class T fuses · Edison Class T fuses AutomationDirect Edison Power Distribution Blocks · Edison Power Distribution Blocks AutomationDirect Stride VPN · Stride VPN AutomationDirect AcuAmp · AcuAmp Fuji Electric BM3 manual motor starters · BM3 manual motor starters Fuji Electric SC contactors and thermal overload relays · GA Fuji Electric SC-NEXT contactors · SC-NEXT contactors Fuji Electric Orange Line / Odyssey contactors · Orange Line / Odyssey contactors Fuji Electric Combination starters · Combination starters Fuji Electric G-Twin Lambda circuit breakers · G-Twin Lambda circuit breakers Fuji Electric G-Twin circuit breakers · G-Twin circuit breakers Fuji Electric EA-UL / SA-UL circuit breakers · EA-UL / SA-UL circuit breakers Fuji Electric EG-UL / SG-UL circuit breakers · EG-UL / SG-UL circuit breakers Fuji Electric SK contactors and relays · SK contactors and relays TDK-Lambda D1SE120-xx-A3 · D1SE120-xx-A3 TDK-Lambda D1SE240-xx-A3 · D1SE240-xx-A3 TDK-Lambda D1SE480-xx-A3 · D1SE480-xx-A3 TDK-Lambda DBM20 · DBM20 TDK-Lambda DRB15 · DRB15 TDK-Lambda DRB30 · DRB30 TDK-Lambda DRB480 · DRB480 TDK-Lambda DRF960 · DRF960 TDK-Lambda DRM40 · DRM40 TDK-Lambda DUSH960-1248-1M · DUSH960-1248-1M PULS QS20.241 · QS20.241 Terasaki TemPower AT air circuit breakers · TemPower AT air circuit breakers Terasaki / NHP TemBreak 1 legacy MCCBs · TemBreak 1 legacy MCCBs Schneider Electric MiCOM protection relays · MiCOM protection relays Invertek Drives Optidrive Eco · Optidrive Eco Schneider Electric MasterPact MTZ · MasterPact MTZ Schneider Electric MasterPacT MTZ Active · MasterPacT MTZ Active Schneider Electric ComPacT NSX, new generation · ComPacT NSX, new generation Schneider Electric ComPacT NSXm, new generation · ComPacT NSXm, new generation Schneider Electric ComPacT for DC networks, new generation · ComPacT for DC networks, new generation Schneider Electric Compact INS/INV · Compact INS/INV Schneider Electric Acti9 iC60 · Acti9 iC60 Schneider Electric Acti9 iC60 RCBO · Acti9 iC60 RCBO Schneider Electric PrismaSeT 6300 · PrismaSeT 6300 Schneider Electric PrismaSeT G · PrismaSeT G Schneider Electric TeSys K contactors · TeSys K contactors Schneider Electric TeSys Giga contactors · TeSys Giga contactors Schneider Electric TeSys Deca overload relays · TeSys Deca overload relays Schneider Electric TeSys GV2, LC · TeSys GV2, LC Schneider Electric PowerLogic PM5000 · PowerLogic PM5000 Schneider Electric PowerLogic PM8000 · PowerLogic PM8000 Schneider Electric PowerLogic P5 protection relays · PowerLogic P5 protection relays Schneider Electric PowerLogic PFC Capacitor Banks · PowerLogic PFC Capacitor Banks Schneider Electric PowerLogic T500 Substation Controller · PowerLogic T500 Substation Controller Schneider Electric TransferPacT · TransferPacT ABB MNS switchgear · MNS switchgear ABB ReliaGear SG switchgear · ReliaGear SG switchgear ABB UniGear switchgear · UniGear switchgear Protection relay IED · GA Medium-voltage switchgear lineup · GA Low-voltage switchgear lineup · GA Source-transfer switch assembly · GA Substation RTU · GA Industrial ventilation fan · GA Lithium battery module · GA DIN-rail adapter accessory · GA Combined fire-smoke damper · GA Victron Energy MultiPlus-II · MultiPlus-II Victron Energy Quattro · Quattro Victron Energy SmartSolar MPPT RS · SmartSolar MPPT RS Victron Energy Cerbo GX · Cerbo GX Victron Energy Lynx Distributor · Lynx Distributor Victron Energy Lynx Smart BMS NG · Lynx Smart BMS NG Victron Energy Lithium NG Batteries · Lithium NG Batteries Victron Energy SmartShunt · SmartShunt Victron Energy Skylla-IP65 · Skylla-IP65 Victron Energy Multi RS Solar · Multi RS Solar Victron Energy MultiPlus-II 2x 120V · MultiPlus-II 2x 120V Victron Energy DIN35 adapter · DIN35 adapter DEIF iE 250 controllers · iE 250 controllers Westermo PS2-60 · PS2-60 Westermo Lynx 5612-E-F4G-T8G-LV · Lynx 5612-E-F4G-T8G-LV Dagartech BGPSW 15 ST · BGPSW 15 ST Dagartech DGB 415 ST · DGB 415 ST Greenheck QEI inline fan · QEI inline fan Greenheck QEID inline fan · QEID inline fan Greenheck TBI-FS inline fan · TBI-FS inline fan Greenheck VAB fan · VAB fan Greenheck VAD fan · VAD fan Greenheck USF fan · USF fan Greenheck APH plenum fan · APH plenum fan Greenheck SBE wall fan · SBE wall fan Greenheck SBS wall fan · SBS wall fan Greenheck SE wall fan · SE wall fan Greenheck ESD-435 louver · ESD-435 louver Greenheck ESD-635 louver · ESD-635 louver Greenheck AFL-501 louver · AFL-501 louver Greenheck FSD-311 damper · FSD-311 damper Greenheck FSD-211 damper · FSD-211 damper Greenheck FD-150 damper · FD-150 damper Power cable joint · CABLE JOINT Power quality meter · PQM Compare withCurrent transformer · CT Voltage transformer · VT / PT Circuit breaker · CB Disconnector · Isolator Load-break switch · LBS Earthing switch · ES Fuse · FU Busbar · Bus Normally open contact · NO Normally closed contact · NC Changeover contact · CO Relay coil · Coil Contactor · KM Normally open pushbutton · PB NO Normally closed pushbutton · PB NC Emergency-stop operator · E-stop Selector switch · SS Indicator lamp · Lamp Terminal connection · Terminal CT test terminal · CT test Power transformer · TX Generator · GEN Three-phase motor · M PLC input / output · PLC I/O Capacitor · C Resistor · R Protective earth · PE Battery · BAT Power converter / inverter · PCS Single-pole circuit breaker · CB 1P Thermal circuit breaker · CB TH Thermal-magnetic circuit breaker · CB TM Current-limiting circuit breaker · CB LIM Residual-current circuit breaker · RCCB Residual-current breaker with overcurrent protection · RCBO Circuit breaker with undervoltage release · CB UV Circuit breaker with electronic trip unit · CB ETU Miniature circuit breaker · MCB Moulded-case circuit breaker · MCCB Air circuit breaker · ACB Additional circuit-breaker pole · CB POLE Switch-disconnector · SD Lockable disconnector · DS LOCK Lockable switch-disconnector · SD LOCK Three-position disconnector · DS 3POS Semiconductor power switch · SSW Unidirectional semiconductor power switch · SSW UNI Two-pole power switch · SW 2P Disconnector auxiliary NO contact · DS AUX NO Disconnector auxiliary NC contact · DS AUX NC Fused switch · SW FUSE Fuse-switch · FUSE SW Additional fused-switch pole · FUSE POLE General-purpose full-range fuse · gG Motor short-circuit fuse · aM Motor full-range fuse · gM Current transformer with two secondaries · CT 2SEC Tapped-secondary current transformer · CT TAP Current transformer with primary conductor indication · CT PRI Core-balance current transformer · CBCT Residual connection of phase CTs · CT RES Single-phase two-winding transformer · TX 1PH Electrostatically screened transformer · TX SCREEN Three-winding transformer · TX 3W Adjustable-ratio transformer · TX ADJ Single-phase autotransformer · AT 1PH Three-phase star autotransformer · AT 3PH Y Star-delta transformer · TX Y-D Delta-star transformer · TX D-Y Delta-delta transformer · TX D-D Star-star transformer · TX Y-Y Star-zigzag transformer · TX Y-Z Star-star-delta three-winding transformer · TX Y-Y-D Delta winding connection · DELTA Open-delta winding connection · OPEN D Star winding connection · STAR Y Star winding with accessible neutral · Y N Zigzag winding connection · ZIGZAG Mechanically latched relay coil · K LATCH Relay reset coil · K RESET Solid-state relay · SSR Polarised relay coil · K POL AC relay coil · K AC High-speed relay · K FAST Measuring relay · K MEAS Relay coil with diode suppression · K DIODE Relay coil with diode and LED · K D LED Relay coil with capacitor suppression · K CAP Relay coil with RC suppression · K RC Counter relay with manual reset · COUNT MAN Counter relay with electrical reset · COUNT ELEC Non-resettable counter relay · COUNT TOTAL On-delay timer relay · TON Off-delay timer relay · TOFF On-delay normally-open contact · TON NO On-delay normally-closed contact · TON NC Off-delay normally-open contact · TOFF NO Off-delay normally-closed contact · TOFF NC Maintained normally-open contact · NO HOLD Maintained normally-closed contact · NC HOLD Manually unlatched NO contact · NO UNLATCH Manually unlatched NC contact · NC UNLATCH Early-make normally-open contact · NO EARLY Late-make normally-open contact · NO LATE Early-break normally-closed contact · NC EARLY Late-break normally-closed contact · NC LATE Make-before-break changeover contact · MBB Motor overload trip NC contact · OL NC Motor overload alarm NO contact · OL NO Illuminated normally-open pushbutton · PB NO LAMP Illuminated normally-closed pushbutton · PB NC LAMP Maintained normally-open pushbutton · PB NO HOLD Maintained normally-closed pushbutton · PB NC HOLD Key-operated normally-open switch · KEY NO Key-operated normally-closed switch · KEY NC Latched key-operated switch · KEY HOLD Pull-cord switch · PULL CORD Foot-operated switch · FOOT Lever-operated switch · LEVER Three-position maintained selector · SEL 3 HOLD Three-position selector returning from left · SEL 3 LRET Three-position selector returning from right · SEL 3 RRET Three-position centre-return selector · SEL 3 CRET Three-position key selector · KEY SEL 3 Four-position maintained selector · SEL 4 HOLD Four-position key selector · KEY SEL 4 Normally-open limit switch · LS NO Normally-closed limit switch · LS NC Roller-operated limit switch · LS ROLLER Cam-operated limit switch · LS CAM Pressure switch NO · PS NO Pressure switch NC · PS NC Temperature switch NO · TS NO Temperature switch NC · TS NC Self-operating thermal switch · TS SELF Float level switch NO · LS FLOAT NO Float level switch NC · LS FLOAT NC Liquid flow switch · FS LIQ Gas flow switch · FS GAS Inductive proximity switch · PROX IND Three-wire inductive proximity switch · PROX IND 3W Capacitive proximity switch · PROX CAP Magnetic proximity switch · PROX MAG Photoelectric emitter-receiver switch · PHOTO Thermocouple · TC Resistance temperature detector · RTD Voltmeter · V Ammeter · A Power-factor meter · PF Phase-angle meter · PHASE Frequency meter · Hz Temperature indicator · TEMP Tachometer · RPM Running-hours meter · HOURS Ampere-hour meter · Ah Recording wattmeter · W REC Reactive-power meter · var Synchronoscope · SYNC SCOPE Active-power indicator · kW Differential voltmeter · DELTA V Active-energy meter · kWh Reactive-energy meter · kvarh Maximum-current monitoring relay · I HIGH Minimum-current monitoring relay · I LOW Current window monitoring relay · I WINDOW Differential-current measuring relay · I DIFF Residual-voltage monitoring relay · U RES Loss-of-voltage monitoring relay · U LOSS Phase-loss monitoring relay · PH LOSS Frequency monitoring relay · f MON Minimum active-power relay · P LOW Feed-through terminal block · TB FEED Disconnect terminal block · TB DISC Knife-disconnect terminal · TB KNIFE Fuse terminal block · TB FUSE Diode terminal block · TB DIODE Component terminal block · TB COMP Multilevel terminal block · TB LEVEL Multi-conductor terminal block · TB MULTI Protective-earth terminal block · TB PE Sensor terminal block · TB SENSOR Actuator terminal block · TB ACT Plug-in terminal block · TB PLUG High-current terminal block · TB POWER Terminal jumper bridge · TB BRIDGE Plug and socket connector pair · PLUG SOCKET Connector plug half · PLUG Connector socket half · SOCKET Wire splice · SPLICE Earth connection · EARTH Functional earth · FE Protective equipotential bonding · BOND PE Functional equipotential bonding · BOND FE Surge arrester · SA Gas-discharge protection tube · GDT Spark-gap protective element · SPARK GAP Variable resistor · R VAR Potentiometer · POT Light-dependent resistor · LDR Heating element · HEATER RC network · RC Varistor · VDR Current-measuring shunt · SHUNT Electrolytic capacitor · C ELEC Feedthrough capacitor · C FEED Adjustable capacitor · C ADJ Three-phase power-factor capacitor · CAP 3PH Reactor · L Iron-core reactor · L IRON Gapped-core inductor · L GAP Adjustable-core inductor · L ADJ Diode · D Photodiode · PD Zener diode · ZD DIAC · DIAC Single-phase bridge rectifier · BR 1PH Three-phase bridge rectifier · BR 3PH Silicon-controlled rectifier · SCR Gate-turn-off thyristor · GTO TRIAC · TRIAC Bidirectional breakdown diode · TVS BI Single-phase AC motor · M 1PH AC Single-phase motor with fan · M 1PH FAN Three-phase AC motor · M 3PH Three-phase motor with fan · M 3PH FAN Wound-rotor induction motor · M WR Three-phase synchronous motor · M 3PH SYNC DC motor · M DC Permanent-magnet DC motor · M DC PM Series-excited DC motor · M DC SERIES Separately excited DC motor · M DC SEP DC generator · G DC Compound-excited DC generator · G DC COMP Three-phase synchronous generator · G 3PH SYNC Permanent-magnet synchronous generator · G 3PH PM AC-to-DC power supply · PSU AC-DC DC-to-DC converter · DC-DC DC-to-AC inverter · INV DC-AC DC uninterruptible power supply · UPS DC AC uninterruptible power supply · UPS AC Capacitor buffer module · BUFFER CAP Redundant power-supply decoupling module · PSU RED Analog current signal isolator · ISO I-I Temperature measuring transducer · TEMP TX Photovoltaic inverter · PV INV Single-phase AC source · AC 1PH Three-phase AC source · AC 3PH Photovoltaic generator · PV GEN Solar generating station · SOLAR STN Wind generating station · WIND STN Substation · SUBSTATION Converter substation · CONV STN Generic electrical load · LOAD Transformer-fed indicator lamp · LAMP TX Push-to-test indicator lamp · LAMP TEST LED indicator lamp · LAMP LED Flashing indicator lamp · LAMP FLASH Flashing beacon · BEACON FLASH Rotating beacon · BEACON ROT PLC digital input · DI PLC relay output · DO RELAY PLC transistor output · DO TRANS PLC analog input · AI PLC analog output · AO PLC temperature input · TI Capacitor voltage transformer · CVT / CCVT ANSI/IEEE circuit breaker symbol · CB ANSI/IEEE thermal circuit breaker symbol · CB TH ANSI/IEEE thermal-magnetic circuit breaker symbol · CB TM ANSI/IEEE current-limiting circuit breaker symbol · CB LIM ANSI/IEEE circuit breaker with undervoltage release symbol · CB UV ANSI/IEEE circuit breaker with electronic trip unit symbol · CB ETU ANSI/IEEE disconnector symbol · Isolator ANSI/IEEE switch-disconnector symbol · SD ANSI/IEEE lockable disconnector symbol · DS LOCK ANSI/IEEE lockable switch-disconnector symbol · SD LOCK ANSI/IEEE fused switch symbol · SW FUSE ANSI/IEEE fuse symbol · FU ANSI/IEEE fuse-switch symbol · FUSE SW ANSI/IEEE current transformer symbol · CT ANSI/IEEE current transformer with two secondaries symbol · CT 2SEC ANSI/IEEE tapped-secondary current transformer symbol · CT TAP ANSI/IEEE voltage transformer symbol · VT / PT ANSI/IEEE power transformer symbol · TX ANSI/IEEE electrostatically screened transformer symbol · TX SCREEN ANSI/IEEE three-winding transformer symbol · TX 3W ANSI/IEEE adjustable-ratio transformer symbol · TX ADJ ANSI/IEEE single-phase autotransformer symbol · AT 1PH ANSI/IEEE reactor symbol · L ANSI/IEEE iron-core reactor symbol · L IRON ANSI/IEEE gapped-core inductor symbol · L GAP ANSI/IEEE adjustable-core inductor symbol · L ADJ ANSI/IEEE normally open contact symbol · NO ANSI/IEEE normally closed contact symbol · NC ANSI/IEEE changeover contact symbol · CO ANSI/IEEE relay coil symbol · Coil ANSI/IEEE mechanically latched relay coil symbol · K LATCH ANSI/IEEE relay reset coil symbol · K RESET ANSI/IEEE polarised relay coil symbol · K POL ANSI/IEEE ac relay coil symbol · K AC ANSI/IEEE relay coil with diode suppression symbol · K DIODE ANSI/IEEE relay coil with rc suppression symbol · K RC ANSI/IEEE on-delay timer relay symbol · TON ANSI/IEEE off-delay timer relay symbol · TOFF ANSI/IEEE maintained normally-open contact symbol · NO HOLD ANSI/IEEE maintained normally-closed contact symbol · NC HOLD ANSI/IEEE early-make normally-open contact symbol · NO EARLY ANSI/IEEE late-make normally-open contact symbol · NO LATE ANSI/IEEE early-break normally-closed contact symbol · NC EARLY ANSI/IEEE late-break normally-closed contact symbol · NC LATE ANSI/IEEE motor overload trip nc contact symbol · OL NC ANSI/IEEE motor overload alarm no contact symbol · OL NO ANSI/IEEE normally open pushbutton symbol · PB NO ANSI/IEEE normally closed pushbutton symbol · PB NC ANSI/IEEE illuminated normally-open pushbutton symbol · PB NO LAMP ANSI/IEEE illuminated normally-closed pushbutton symbol · PB NC LAMP ANSI/IEEE maintained normally-open pushbutton symbol · PB NO HOLD ANSI/IEEE maintained normally-closed pushbutton symbol · PB NC HOLD ANSI/IEEE selector switch symbol · SS ANSI/IEEE three-position maintained selector symbol · SEL 3 HOLD ANSI/IEEE three-position centre-return selector symbol · SEL 3 CRET ANSI/IEEE three-position key selector symbol · KEY SEL 3 ANSI/IEEE four-position maintained selector symbol · SEL 4 HOLD ANSI/IEEE four-position key selector symbol · KEY SEL 4 ANSI/IEEE normally-open limit switch symbol · LS NO ANSI/IEEE normally-closed limit switch symbol · LS NC ANSI/IEEE roller-operated limit switch symbol · LS ROLLER ANSI/IEEE pressure switch no symbol · PS NO ANSI/IEEE pressure switch nc symbol · PS NC ANSI/IEEE temperature switch no symbol · TS NO ANSI/IEEE temperature switch nc symbol · TS NC ANSI/IEEE float level switch no symbol · LS FLOAT NO ANSI/IEEE float level switch nc symbol · LS FLOAT NC ANSI/IEEE liquid flow switch symbol · FS LIQ ANSI/IEEE terminal connection symbol · Terminal ANSI/IEEE numbered terminal symbol · TERM 1 ANSI/IEEE plug and socket connector pair symbol · PLUG SOCKET ANSI/IEEE connector plug half symbol · PLUG ANSI/IEEE connector socket half symbol · SOCKET ANSI/IEEE wire splice symbol · SPLICE ANSI/IEEE protective earth symbol · PE ANSI/IEEE functional earth symbol · FE ANSI/IEEE resistor symbol · R ANSI/IEEE variable resistor symbol · R VAR ANSI/IEEE potentiometer symbol · POT ANSI/IEEE light-dependent resistor symbol · LDR ANSI/IEEE heating element symbol · HEATER ANSI/IEEE varistor symbol · VDR ANSI/IEEE current-measuring shunt symbol · SHUNT ANSI/IEEE capacitor symbol · C ANSI/IEEE electrolytic capacitor symbol · C ELEC ANSI/IEEE feedthrough capacitor symbol · C FEED ANSI/IEEE adjustable capacitor symbol · C ADJ ANSI/IEEE diode symbol · D ANSI/IEEE photodiode symbol · PD ANSI/IEEE zener diode symbol · ZD ANSI/IEEE single-phase bridge rectifier symbol · BR 1PH ANSI/IEEE silicon-controlled rectifier symbol · SCR ANSI/IEEE triac symbol · TRIAC ANSI/IEEE voltmeter symbol · V ANSI/IEEE ammeter symbol · A ANSI/IEEE power-factor meter symbol · PF ANSI/IEEE frequency meter symbol · Hz ANSI/IEEE recording wattmeter symbol · W REC ANSI/IEEE reactive-power meter symbol · var ANSI/IEEE synchronoscope symbol · SYNC SCOPE ANSI/IEEE running-hours meter symbol · HOURS ANSI/IEEE single-phase ac motor symbol · M 1PH AC ANSI/IEEE three-phase ac motor symbol · M 3PH ANSI/IEEE wound-rotor induction motor symbol · M WR ANSI/IEEE dc motor symbol · M DC ANSI/IEEE permanent-magnet dc motor symbol · M DC PM ANSI/IEEE three-phase synchronous generator symbol · G 3PH SYNC ANSI/IEEE dc generator symbol · G DC ANSI/IEEE indicator lamp symbol · Lamp ANSI/IEEE transformer-fed indicator lamp symbol · LAMP TX ANSI/IEEE push-to-test indicator lamp symbol · LAMP TEST ANSI/IEEE led indicator lamp symbol · LAMP LED ANSI/IEEE on-delay normally-open contact symbol · TON NO ANSI/IEEE on-delay normally-closed contact symbol · TON NC ANSI/IEEE off-delay normally-open contact symbol · TOFF NO ANSI/IEEE off-delay normally-closed contact symbol · TOFF NC Positive-operation direction qualifier · Q070109 Manual-operation qualifier · Q021301 Protected-access manual-operation qualifier · Q021302 Pushbutton-operation qualifier · Q021305 Emergency-operation qualifier · Q021308 Rotary-operation qualifier · Q021304 Key-operation qualifier · Q021313 Foot-operation qualifier · Q021310 Lever-operation qualifier · Q021311 Crank-operation qualifier · Q021214 Handwheel-operation qualifier · Q021309 Liquid-level actuation qualifier · Q021401 Event-count actuation qualifier · Q021402 Liquid-flow actuation qualifier · Q021403 Gas-flow actuation qualifier · Q021404 Motor-operation qualifier · Q021326 Timed-operation qualifier · Q021327 Roller-operation qualifier · Q021315 Cam-operation qualifier · Q021316 Cam-profile indication · Q021317 Switch-position function qualifier · Q070106 Isolation-function qualifier · Q070103 Switch-disconnector function qualifier · Q070104 Circuit-breaker function qualifier · Q070102 Power-contactor function qualifier · Q070101 Automatic-trip qualifier · Q070105 Spring-return qualifier · Q070107 Maintained-position qualifier · Q070108 One-way linear-motion qualifier · Q020401R Two-way linear-motion qualifier · Q020402 Transition indication · Q101101 One-way rotary-motion qualifier · Q020403 Two-way rotary-motion qualifier · Q020404 Limited two-way rotary-motion qualifier · Q020405 Unidirectional propagation qualifier · Q020501 Simultaneous bidirectional propagation qualifier · Q020502 Alternating bidirectional propagation qualifier · Q020503 Signal-transmission qualifier · Q020504 Signal-reception qualifier · Q020505 Outbound-energy-flow qualifier · Q020506 Inbound-energy-flow qualifier · Q020507 Bidirectional-energy-flow qualifier · Q020508 Thermal-effect qualifier · Q020801 Magnetic-effect qualifier · Q020802 Magnetostrictive-effect qualifier · Q020803 Magnetic-field-effect qualifier · Q020804 Non-ionising radiation qualifier · Q020901 Ionising-radiation qualifier · Q020903 Presumed-fault-location indication · Q021701 Insulation-failure indication · Q021702 Two-phase winding connection · Q060201 Partial-V winding connection · Q060202 Four-phase winding with accessible connection · Q060203 Three-phase T winding connection · Q060204 Six-phase double-delta winding connection · Q060210 Six-phase polygon winding connection · Q060211 Six-phase star winding connection · Q060212 Six-phase double-zigzag winding connection · Q060213 Direct-current supply qualifier · Q020201 Alternating-current supply qualifier · Q020204 Rectified-current with AC component qualifier · Q020212 Automatic mechanical-return indication · Q021207 Mechanical stop-latch indication · Q021208 Mechanical stop latch in neutral state · Q021209 Mechanical stop latch in engaged state · Q021210 Mechanical interlock between devices · Q021211 Two-way latching device · Q1020603 Manually released latching device · Q1020604 Key-controlled two-way latching device · Q1029603 Mechanical clutch connection · Q021216 Disconnected mechanical coupling · Q021217 Engaged mechanical coupling · Q021218 Mechanical gear connection · Q021223 Thermocouple with terminal board · HTC1LTB Pyrometer indication · HIN1P25 Clock indication · HIN1P29 Minute-pulse clock contact · HIN1P33 Pressure-to-current converter · HIN1B10 Single-phase AC-to-DC current converter · HIN1G1 Tachometric dynamo · HIN1B11 Impulse tachometric transducer · HIN1B12 Optical tachometric transducer · HIN1B13 Audible bell · HAN1B Audible buzzer · HAN1Z Audible siren · HAN1S Loudspeaker annunciation · HAN1B7 Combined loudspeaker and microphone · HAN1B8 Microphone input · HAN1B9 Solenoid valve actuator · HSV1 Solenoid closing function for an open valve · HSV1Y1 Electromagnetic brake actuator · HSV1Y4 Solenoid-valve NO auxiliary contact · HSV21 Solenoid-valve NC auxiliary contact · HSV22 Ultrasonic proximity switch · HPX1U Ultrasonic NO switching output · HPX11U Ultrasonic NC switching output · HPX12U Three-wire ultrasonic sensor · HPX11U3 Touch-sensitive switch · HPX1TS Touch-switch NO output · HPX11TS Touch-switch NC output · HPX12TS Three-wire touch-sensitive switch · HPX11TS3 Phase-to-phase voltmeter selector · HSW1S90 Phase-to-neutral voltmeter selector · HSW1S91 Combined line and phase voltmeter selector · HSW1S92 Two-network voltage measurement selector · HSW1S93 Three-point current measurement selector · HSW1S94 Four-point current measurement selector · HSW1S95 Latched pull-cord switch · HPC11L Latched foot-operated switch · HFT11L Latched lever-operated switch · HPB11LSL Three-phase motor with four connections · HMO14 Three-phase induction motor with series excitation · HMO1M3 Star-stator wound-rotor motor with rotor starter · HMO1M5 Six-pole asynchronous motor · HMO1M11 Single-phase series-connected AC motor · HMO1M10 Single-phase synchronous motor · HMO1M16 Permanent-magnet linear DC motor · HMO1M14 Permanent-magnet stepping motor · HMO1M15 Shunt-excited DC motor · HMO1M8 Resistor with disconnecting slider · HVR1R5 Carbon-disc variable resistor · HVR1R8 Magnetoresistive element · HVR1S00689 Differential capacitor · HCA1_S00573 Preset-adjustable capacitor · HCA1_S00575 Split adjustable capacitor · HCA1_S00579 Cable identification marker · HW01 Additional cable-core marker · HW02 Twisted-pair indication · HT0_TW Single power receptacle · HCN1RSGL Duplex power receptacle · HCN1RDUP Generic device boundary · HDV1T6 Standalone source cross-reference · HA2S1_REF Standalone destination cross-reference · HA2D1_REF Reference-only wire arrow · HA1X1 One-line connector representation · HC01PJ_1- One-line terminal representation · HT0001_1- One-line cable identification · HW01_1- One-line bus tap · HDV1_BT_1- One-line power receptacle · HC01WR_1- Connector retaining wire identity · HC01PJ Connector changing wire identity · HCN1PJ Terminal carrying wire identification · HT0W02 Terminal with wire-number transition · HT1002 Conductor connection junction · JUNCTION Unconnected conductor crossing · CROSSING Three-phase conductor group · 3~ Dy5 transformer connection reference · Dy5 Dd6 transformer connection reference · Dd6 Yd5 transformer connection reference · Yd5 Yy6 transformer connection reference · Yy6 Yd11 transformer connection reference · Yd11 Dy11 transformer connection reference · Dy11 Dz0 transformer connection reference · Dz0 Yz5 transformer connection reference · Yz5 Dz6 transformer connection reference · Dz6 Yz11 transformer connection reference · Yz11 Schottky diode · SBD Unidirectional TVS diode · TVS Light-emitting diode · LED Varactor diode · VAR PIN diode · PIN NPN bipolar transistor · NPN PNP bipolar transistor · PNP NPN Darlington transistor · NPN-DAR PNP Darlington transistor · PNP-DAR N-channel JFET · N-JFET P-channel JFET · P-JFET N-channel enhancement MOSFET · N-MOS P-channel enhancement MOSFET · P-MOS N-channel depletion MOSFET · N-DMOS Insulated-gate bipolar transistor · IGBT MOSFET body diode · BODY-D GaN enhancement-mode HEMT · E-HEMT Integrated gate-commutated thyristor · IGCT NPN phototransistor · PHOTO-NPN Phototransistor optocoupler · OPTO-TR Photodiode optocoupler · OPTO-PD Phototriac optocoupler · OPTO-TRIAC Photovoltaic MOSFET driver · PV-DRV Capacitive digital isolator · DIG-ISO Isolated gate driver · ISO-GD Low-side gate driver · LS-GD High-side gate driver · HS-GD Bootstrap gate-drive supply · BOOT Ideal-diode controller · IDEAL-D Hot-swap controller · HOT-SWAP Electronic fuse IC · EFUSE Half-bridge power module · HB-MOD Three-phase sixpack power module · 6-PACK AND gate · AND OR gate · OR NAND gate · NAND NOR gate · NOR Exclusive-OR gate · XOR Exclusive-NOR gate · XNOR Logic inverter · NOT Non-inverting logic buffer · BUF Three-state logic buffer · 3STATE Schmitt-trigger inverter · SCHMITT-NOT Schmitt-trigger buffer · SCHMITT Positive-edge D flip-flop · D-FF Negative-edge JK flip-flop · JK-FF Set-reset latch · SR-LATCH Transparent D latch · D-LATCH Serial-in parallel-out register · SIPO Parallel-in serial-out register · PISO Shift register with output latch · SHIFT-LATCH Ripple binary counter · CTR-RIP Synchronous binary counter · CTR-SYNC Decoded decade counter · DECADE Retriggerable monostable · ONE-SHOT Binary decoder / demultiplexer · DEC Priority encoder · ENC-PRI Digital multiplexer · MUX Digital magnitude comparator · MAG-COMP Binary full adder · ADD Logic bus transceiver · BUS-TR Logic voltage-level translator · LEVEL Open-collector buffer · OC-BUF Parity generator / checker · PARITY Phase-locked loop · PLL Voltage-controlled oscillator · VCO Clock generator · CLK-GEN Watchdog timer · WDT Operational amplifier · OP-AMP Voltage comparator · COMP Instrumentation amplifier · INA Difference amplifier · DIFF-AMP Fully differential amplifier · FDA Current-sense amplifier · CSA Isolation amplifier · ISO-AMP Operational transconductance amplifier · OTA Analogue multiplier · MULT Analogue bilateral switch · A-SW Analogue multiplexer · A-MUX Sample-and-hold amplifier · S/H Analogue-to-digital converter · ADC Digital-to-analogue converter · DAC Series voltage reference · VREF-S Shunt voltage reference · VREF-H Precision rectifier · PREC-RECT RMS-to-DC converter · RMS-DC Voltage / frequency converter · V/F Inverting amplifier circuit · INV-AMP Non-inverting amplifier circuit · NI-AMP Op-amp integrator · INTEGRATOR Op-amp differentiator · DIFFERENTIATOR Active low-pass filter · LPF Active high-pass filter · HPF Active band-pass filter · BPF Active notch filter · NOTCH Transimpedance amplifier · TIA Buck converter topology · BUCK Boost converter topology · BOOST Inverting buck-boost topology · INV-BB Four-switch buck-boost topology · 4SW-BB SEPIC converter topology · SEPIC Cuk converter topology · CUK Zeta converter topology · ZETA Flyback converter topology · FLYBACK Forward converter topology · FORWARD Active-clamp forward topology · ACF Push-pull converter topology · PUSH-PULL Half-bridge DC converter topology · HB-DC Full-bridge DC converter topology · FB-DC Phase-shifted full-bridge topology · PSFB LLC resonant converter topology · LLC Dual-active-bridge topology · DAB Single-phase voltage-source inverter · 1PH-VSI Three-phase voltage-source inverter · 3PH-VSI Neutral-point-clamped inverter · NPC Active front-end rectifier · AFE Battery fuel gauge · SoC Battery charger controller · CHG Battery protection controller · BPROT Battery cell voltage monitor · CELL V Passive battery cell balancer · BAL R Active battery cell balancer · BAL X Battery cell temperature monitor · CELL T Battery pack monitor · PACK Battery precharge circuit · PRE Battery insulation monitoring function · IMD Battery pack current measurement · PACK I AC electric vehicle charge point · AC EV EV control pilot interface · CP EV charging residual-current detection · RCD EV EV charging contactor control · EV K DC electric vehicle charging station · DC EV Bidirectional EV charging interface · V2G EV charger power module · EV PWR EV charging energy measurement · EV kWh Photovoltaic module · PV MOD Photovoltaic string · PV STR Photovoltaic string combiner · COMB MPPT solar charge controller · MPPT Photovoltaic power optimiser · PV OPT Photovoltaic rapid shutdown function · RSD Photovoltaic arc-fault detection · PV AFD CAN bus transceiver · CAN CAN FD transceiver · CAN FD LIN bus transceiver · LIN RS-485 transceiver · RS485 RS-422 interface · RS422 RS-232 transceiver · RS232 Ethernet physical-layer transceiver · PHY Single-pair Ethernet interface · SPE PoE powered-device interface · PoE PD PoE power-sourcing interface · PoE PSE I2C bus buffer · I2C BUF I2C voltage-level translator · I2C LVL SPI interface buffer · SPI BUF LVDS line driver · LVDS TX LVDS line receiver · LVDS RX Magnetic digital isolator · ISO MAG Isolated comparator · ISO CMP Isolated CAN transceiver · ISO CAN Isolated RS-485 transceiver · ISO 485 Isolated I2C interface · ISO I2C Isolated analogue-to-digital converter · ISO ADC Power-source multiplexer · PWR MUX Reverse-polarity protection controller · REV POL Integrated load switch · LOAD SW Smart high-side switch · HS SW Low-side power switch · LS SW Linear voltage regulator · LIN REG Low-dropout voltage regulator · LDO Supply voltage supervisor · SVS Power-good indication · PG Window voltage supervisor · V WIN Power-rail sequencer · SEQ Power-rail enable interface · EN Hall-effect current sensor · HALL I Magnetic position sensor · MAG POS Inductive position sensor · IND POS Ultrasonic distance sensor · US DIST Radar level sensing function · RAD LVL Pressure measurement interface · P MEAS Capacitive level sensor · CAP LVL Relative humidity sensor · RH Flexible conductor · W Screened conductor · W Screened multi-conductor cable · W Screened conductor with earthed screen · W Screened twisted pair · W Coaxial cable · W Coaxial cable with earthed outer conductor · W Conductor in conduit · W Overhead line · OHL Underground cable · UGC Underwater cable · SC Optical fibre cable · OF Conductors within one cable · W Conductor count by numeral · n Neutral conductor mark · N Protective conductor mark · PE PEN conductor mark · PEN Three-phase circuit with neutral and PE marking · 3/N/PE Interchange of conductors · X Conductor branching from a group · W T-connection without junction dot · - Double junction of conductors · - ANSI/IEEE conductor junction symbol · - ANSI/IEEE crossing conductor hop symbol · - ANSI/IEEE shielded conductor symbol · W ANSI/IEEE coaxial cable symbol · W ANSI/IEEE twisted pair symbol · TW ANSI/IEEE multi-conductor cable symbol · W Single-core cable sealing end · SE Multicore cable sealing end · SE Cable straight-through joint · J Cable branch joint · J Cable transition joint · J Separable cable connector · X Sealed cable end · W ANSI/IEEE cable pothead symbol · PH Feeder busway · BD Plug-in busway · BD Busway tap-off connection · TO Busway end feed unit · EF Power distribution block · X Multi-pole plug and socket · X Coaxial plug and socket · X Fibre-optic connector · X Inline cable coupler · X Connector with protective earth contact · X Plug and jack with common pin number · X Additional connector pin · X ANSI/IEEE coaxial connector symbol · J Neutral link, closed · N Neutral link, open · N Bolted connecting link, closed · X Bolted connecting link, open · X Removable earth test link · E Neutral-to-earth link · MEN ANSI/IEEE terminal jumper symbol · JMP ANSI/IEEE main bonding jumper symbol · MBJ Flexible bonding strap · BS Frame or chassis connection · - ANSI/IEEE chassis ground symbol · - Noiseless earth · - Earth electrode · E Earth grid conductor · EG Earth electrode with inspection pit · E Lightning protection down-conductor · DC Lightning air termination · AT Lightning protection test joint · TJ Main earthing terminal · MET ANSI/IEEE earth connection symbol · - ANSI/IEEE protective equipotential bonding symbol · - ANSI/IEEE functional equipotential bonding symbol · - Direct neutral earthing connection · - Cable screen cross-bonding · CB ANSI/IEEE surge arrester symbol · SA ANSI/IEEE spark gap symbol · SG ANSI/IEEE gas discharge tube symbol · GDT Double spark gap · F Symmetric gas discharge tube · F ANSI/IEEE terminal with wire number symbol · TB ANSI/IEEE terminal with wire number change symbol · TB Socket outlet with protective earth contact · SO Switched socket outlet · SSO Socket outlet with interlocked switch · SOI Three-phase socket outlet · SO3 Weatherproof socket outlet · SO-IP Shaver supply unit · SSU Multiple socket outlet · SOn RCD-protected socket outlet · SO-RCD Fused connection unit plan mark · FCU Flex outlet plate · FO Cooker control unit · CCU Floor box outlet · FB ANSI single receptacle outlet plan symbol · R ANSI duplex receptacle outlet plan symbol · DR ANSI GFCI duplex receptacle plan symbol · GFCI ANSI weatherproof receptacle plan symbol · WP ANSI special-purpose outlet plan symbol · SP One-way light switch plan mark · S1 Two-pole one-way switch plan mark · S2P Two-way light switch plan mark · S2W Intermediate light switch plan mark · SI Dimmer switch plan mark · SD Ceiling pull-cord switch plan mark · SPC Time-delay push switch plan mark · ST Push button plan mark · PB Switch with pilot light plan mark · SPL Lighting presence detector plan mark · PIR-L Photoelectric light switch plan mark · PE ANSI single-pole switch plan symbol · S ANSI three-way switch plan symbol · S3 ANSI four-way switch plan symbol · S4 ANSI dimmer switch plan symbol · SD Distribution board plan mark · DB ANSI panelboard plan symbol · PNL Junction box plan mark · JB Local isolator plan mark · ISO Ceiling fan plan mark · CF Extract fan plan mark · EF Electric space heater plan mark · HTR Water heater plan mark · WH Room thermostat plan mark · TS Time switch plan mark · TSW Luminaire general plan symbol · L Wall-mounted luminaire plan mark · LW Linear fluorescent luminaire plan mark · LF Multi-tube fluorescent luminaire plan mark · LF3 Recessed downlight plan mark · DL Spotlight plan mark · SPT Floodlight plan mark · FL Maintained emergency luminaire plan mark · EM-M Non-maintained emergency luminaire plan mark · EM-NM Exit sign luminaire plan mark · EXIT Lighting track plan mark · TRK Pole-mounted luminaire plan mark · LP ANSI ceiling lighting outlet plan symbol · LO ANSI wall lighting outlet plan symbol · LOW ANSI exit light outlet plan symbol · X Smoke detector plan symbol · SD Fixed-temperature heat detector plan symbol · HD Rate-of-rise heat detector plan symbol · HD-R Multi-sensor fire detector plan symbol · MSD Optical beam smoke detector plan symbol · BD Flame detector plan symbol · FD Duct smoke detector plan symbol · DSD Manual call point plan symbol · MCP Fire alarm sounder plan symbol · SNDR Combined sounder and visual alarm device plan symbol · SVAD Fire alarm control panel plan symbol · FACP Magnetic door holder plan symbol · DH Firefighter telephone outlet plan symbol · FFT ANSI smoke detector plan symbol · SD ANSI manual fire alarm station plan symbol · F ANSI fire alarm horn-strobe plan symbol · HS Intruder motion detector plan symbol · PIR Door contact plan symbol · DC CCTV camera plan symbol · CAM Data outlet plan symbol · DO Telephone outlet plan symbol · TO Telephone set symbol · TEL Television outlet plan symbol · TV Antenna symbol · ANT Dish antenna symbol · SAT Fibre-optic link symbol · FO Media converter symbol · MC Network switch symbol · SW Network router symbol · RTR Firewall symbol · FW Wireless access point symbol · WAP Server symbol · SRV Door intercom station symbol · IC IEC AND gate (rectangular form) · & IEC OR gate (rectangular form) · ≥1 IEC NAND gate (rectangular form) · & IEC NOR gate (rectangular form) · ≥1 IEC exclusive-OR gate (rectangular form) · =1 IEC exclusive-NOR gate (rectangular form) · =1 IEC NOT element (rectangular form) · 1 IEC buffer element (rectangular form) · 1 IEC three-state buffer (rectangular form) · EN IEC Schmitt-trigger buffer (rectangular form) · 1 IEC Schmitt-trigger inverter (rectangular form) · 1 IEC open-collector buffer (rectangular form) · 1 IEC logic identity element · = IEC even-parity element · 2k IEC odd-parity element · 2k+1 IEC AND-OR-invert element · AOI IEC common-output element · COE ANSI three-input AND gate · AND3 ANSI four-input NAND gate · NAND4 ANSI three-input OR gate · OR3 ANSI three-input NOR gate · NOR3 ANSI AND-OR-invert gate · AOI ANSI NAND gate drawn as negative-input OR · NAND ANSI NOR gate drawn as negative-input AND · NOR ANSI open-collector inverter · OC-NOT ANSI wired-AND connection · WIRED-AND ANSI three-state inverter with active-low enable · OE ANSI Schmitt-trigger NAND gate · NAND-ST ANSI inhibit gate (AND with one negated input) · INH IEC logic negation at input · NEG-IN IEC logic negation at output · NEG-OUT IEC polarity indicator at input (active-low input) · POL-IN IEC polarity indicator at output (active-low output) · POL-OUT IEC dynamic input (edge-triggered) · DYN IEC dynamic input with negation (falling edge) · DYN-NEG IEC postponed output qualifier · POSTPONED IEC open-circuit output, L-type (open collector) · OC-L IEC open-circuit output, H-type (open emitter) · OC-H IEC three-state output qualifier · 3S IEC hysteresis (bi-threshold) qualifier · HYST IEC enable input (EN) · EN IEC common-control block · CCB IEC AND dependency (G) · Gm IEC OR dependency (V) · Vm IEC negate dependency (N) · Nm IEC control dependency (C) · Cm IEC mode dependency (M) · Mm IEC interconnection dependency (Z) · Zm IEC address dependency (A) · Am IEC set and reset dependency (S, R) · Sm/Rm IEC D flip-flop (rectangular form) · 1D IEC JK flip-flop (rectangular form) · 1J 1K IEC SR latch (rectangular form) · S R IEC transparent D latch (rectangular form) · C1 1D IEC T (toggle) flip-flop · 1T IEC pulse-triggered (master-slave) JK flip-flop · 1J 1K IEC clocked SR flip-flop · 1S 1R IEC non-retriggerable monostable · 1⊓ IEC retriggerable monostable · ⊓ IEC astable element · G ANSI cross-coupled NAND latch · S̄R̄ ANSI cross-coupled NOR latch · SR IEC synchronous binary counter (CTRm) · CTR4 IEC ripple counter (RCTRm) · RCTR IEC decade counter (CTR DIV10) · CTR DIV10 IEC up/down counter · CTR +/- IEC shift register (SRGm) · SRG8 IEC bidirectional (universal) shift register · SRG4 IEC multiplexer (MUX) · MUX IEC binary decoder (X/Y coder) · BIN/OCT IEC priority encoder (HPRI/BIN) · HPRI/BIN IEC BCD-to-seven-segment decoder · BCD/7SEG IEC general code converter (X/Y) · X/Y IEC magnitude comparator (COMP) · COMP IEC adder (Σ) · Σ IEC arithmetic logic unit (ALU) · ALU IEC read-only memory (ROM) · ROM IEC random-access memory (RAM) · RAM IEC first-in first-out memory (FIFO) · FIFO IEC operational amplifier (rectangular form) · ▷∞ IEC summing amplifier element (Σ) · Σ IEC integrator element (∫) · ∫ IEC differentiator element (d/dt) · d/dt IEC analogue multiplier element · Π IEC sample-and-hold element · S/H ANSI operational amplifier (triangle form) · OA Op-amp voltage follower · BUF Op-amp comparator with hysteresis · COMP-H IEC subtracter (P-Q) · P-Q IEC look-ahead carry generator (CPG) · CPG ANSI/IEEE phase-angle meter symbol · PH ANSI/IEEE thermometer symbol · T ANSI/IEEE tachometer symbol · TACH ANSI/IEEE ampere-hour meter symbol · Ah ANSI/IEEE thermocouple symbol · TC ANSI/IEEE thermocouple with terminal board symbol · TC ANSI/IEEE active power indicator symbol · W ANSI/IEEE thermometer/pyrometer symbol · PYR ANSI/IEEE differential voltmeter symbol · ΔV ANSI/IEEE pressure/current converter symbol · P/I ANSI/IEEE single-phase AC-DC current converter symbol · I~/I= ANSI/IEEE tachometric dynamo symbol · TG ANSI/IEEE impulse tachometric dynamo symbol · TP ANSI/IEEE optical tachometric dynamo symbol · TO ANSI/IEEE current transformer with conductor indication symbol · CT Reverse-current measuring relay · K Percentage-biased differential current relay · K Neutral-current measuring relay · K Neutral-unbalance relay between two polyphase systems · K Earth-fault current relay · K Minimum-voltage measuring relay · K Maximum-voltage measuring relay · K Earth-fault voltage relay · K Minimum-impedance measuring relay · K Insulation monitoring relay · IMD Indicating instrument general symbol · * Recording instrument general symbol · * Integrating instrument general symbol · * Ohmmeter · Ω Insulation resistance meter · MΩ Galvanometer · G Oscilloscope · OSC Recording voltmeter · V Recording ammeter · A Combined recording wattmeter and varmeter · W/var Apparent-energy meter · kVAh Bidirectional active-energy meter · kWh Multi-rate energy meter · kWh Energy meter with maximum-demand indicator · kWh/MD Excess-energy meter · kWh> Energy meter with pulse transmitter · kWh Energy meter repeater · kWh Prepayment energy meter · kWh Volt-squared-hour meter · V²h Summation energy meter · Σ kWh Maximum-demand indicator · MD Phase-sequence indicator · PSI Voltage presence indicating system · VPIS Double voltmeter · V V Double frequency meter · Hz Hz Multifunction power meter · PM Power quality analyser · PQ Disturbance recorder · DFR Sequence-of-events recorder · SOE Phasor measurement unit · PMU Active-power transducer · P/I Voltage measuring transducer · U/I Multi-core current transformer · CT Summation current transformer · ΣCT Interposing current transformer · ICT Rogowski coil current sensor · RC Wound-primary current transformer · CT Bushing current transformer · BCT Voltage transformer with two secondary windings · VT Voltage transformer set with broken-delta residual winding · VT Open-delta voltage transformer connection · VT Combined instrument transformer · CT/VT Resistive voltage divider sensor · RVD Low-power current transformer · LPCT Optical current sensor · OCT Numerical protection relay (IED) · IED Trip-circuit supervision relay · TCS Buchholz relay · BR Winding temperature indicator · WTI Thermistor motor protection relay · PTC Arc-flash point light sensor · AF Arc-flash fibre loop sensor · AF Residual current monitor · RCM Definite-time delay qualifier for measuring relays · t Inverse-time characteristic qualifier · IDMT Directional measuring element qualifier · → Relay test block · TB Test plug · TP Current test switch with shorting contact · TS Potential test switch · TS Synchronising lamps · SL Fault passage indicator · FPI Surge arrester counter · SC Vibration sensor · VS Partial discharge sensor · PD Fixed-speed wind turbine generator (Type 1) · WTG T1 Variable-slip wind turbine generator (Type 2) · WTG T2 Doubly-fed induction generator · DFIG Full-converter wind turbine generator (Type 4) · WTG T4 Three-phase induction generator · G 3~ ASG Single-phase synchronous generator · G 1~ Synchronous generator with brushless exciter · G 3~ BX ANSI/IEEE permanent-magnet synchronous generator symbol · PMG ANSI/IEEE compound-excited DC generator symbol · G DC CMP Diesel generator set · DG Gas engine generator set · GG Gas turbine generator · GTG Hydro turbine generator · HG Fuel cell · FC Hydrogen electrolyser · ELY Flywheel energy storage · FESS Supercapacitor bank · SC Single battery cell · GB cell Battery string · BS Battery rack · BR Battery energy storage system · BESS Centre-tapped battery bank · GB ± ANSI/IEEE battery symbol · BT Battery power conversion system · PCS Float and boost battery charger · BC Thyristor phase-controlled rectifier · SCR REC Twelve-pulse rectifier · 12P Grid-forming inverter · GFM Grid-following inverter · GFL Hybrid inverter · HYB INV Bidirectional inverter-charger · INV/CHG PV string inverter · INV STR PV central inverter · INV CTR PV microinverter · MI Bidirectional DC-to-DC converter · DC/DC BI Isolated DC-to-DC converter · DC/DC ISO Static frequency converter · SFC Motor-generator set · MG Static transfer switch · STS Automatic transfer switch · ATS Manual transfer switch · MTS Closed-transition transfer switch · CTTS Bypass-isolation transfer switch · BP/ATS Online double-conversion UPS · UPS VFI Line-interactive UPS · UPS VI Offline standby UPS · UPS VFD Rotary UPS · RUPS UPS maintenance bypass · MBP Static var compensator · SVC Thyristor-controlled reactor · TCR Thyristor-switched capacitor · TSC Static synchronous compensator · STATCOM Synchronous condenser · SC Single-tuned harmonic filter · HF Damped high-pass harmonic filter · HPF Active harmonic filter · AHF Detuned capacitor bank · DCB Dynamic voltage restorer · DVR Point of common coupling · PCC Utility grid connection · GRID Grid equivalent source · EQ SRC Microgrid interconnection switch · MIS Resistive load bank · LB Resistive-reactive load bank · LB RL Neutral earthing resistor · NER Arc suppression coil · ASC Microgrid controller · MGC Genset controller · GC Power plant controller · PPC Dump load controller · DLC Split-phase inverter · INV 2x120 IEC pushbutton contact: mushroom head normally open momentary · PB IEC pushbutton contact: mushroom head normally closed momentary · PB IEC pushbutton contact: mushroom head normally open latching · PB IEC pushbutton contact: mushroom head normally closed latching · PB IEC pushbutton contact: mushroom head normally open twist latch · PB IEC pushbutton contact: mushroom head normally closed twist latch · PB IEC pushbutton contact: mushroom head normally open latching, pull to disengage · PB IEC pushbutton contact: mushroom head normally closed latching, pull to disengage · PB IEC pushbutton contact: mushroom head normally open latching, key operated · PB IEC pushbutton contact: mushroom head normally closed latching, key operated · PB IEC pushbutton contact: normally open push button recessed · PB IEC pushbutton contact: normally closed push button recessed · PB IEC pushbutton contact: normally open push button recessed latched · PB IEC pushbutton contact: normally closed push button recessed latched · PB IEC pushbutton contact: normally open push button positive make · PB IEC pushbutton contact: normally closed push button positive break · PB IEC selector-switch contact: 2 position maintain, normally closed · SS IEC selector-switch contact: 2 position normally open return from left · SS IEC selector-switch contact: 2 position normally closed return from left · SS IEC selector-switch contact: 2 position normally open return from right · SS IEC selector-switch contact: 2 position normally closed return from right · SS IEC selector-switch contact: 2 position normally open with lamp · SS IEC selector-switch contact: 2 position normally closed with lamp · SS IEC selector-switch contact: normally open anticipated contact · SS IEC selector-switch contact: normally open delayed contact · SS IEC selector-switch contact: normally closed anticipated contact · SS IEC selector-switch contact: normally closed delayed contact · SS IEC selector-switch contact: 3 position maintain, normally closed · SS IEC selector-switch contact: 3 position normally closed return from left · SS IEC selector-switch contact: 3 position normally closed return from right · SS IEC selector-switch contact: 3 position normally closed return from both · SS IEC selector-switch contact: 3 position normally open neutral 0 · SS IEC selector-switch contact: 3 position normally closed neutral 0 · SS IEC selector-switch contact: 3 position normally open neutral 1 · SS IEC selector-switch contact: 3 position normally closed neutral 1 · SS IEC selector-switch contact: 3 position normally open neutral 2 · SS IEC selector-switch contact: 3 position normally closed neutral 2 · SS IEC selector-switch contact: 3 position normally closed key operated neutral 0 · SS IEC selector-switch contact: 3 position normally open key operated neutral 1 · SS IEC selector-switch contact: 3 position normally closed key operated neutral 1 · SS IEC selector-switch contact: 3 position normally open key operated neutral 2 · SS IEC selector-switch contact: 3 position normally closed key operated neutral 2 · SS IEC selector-switch contact: 3 stable position normally open key operated neutral 0 · SS IEC selector-switch contact: 3 stable position normally closed key operated neutral 0 · SS IEC selector-switch contact: 3 stable position normally open key operated neutral 1 · SS IEC selector-switch contact: 3 stable position normally closed key operated neutral 1 · SS IEC selector-switch contact: 3 stable position normally open key operated neutral 2 · SS IEC selector-switch contact: 3 stable position normally closed key operated neutral 2 · SS IEC selector-switch contact: 4 position maintain, normally closed · SS IEC selector-switch contact: 4 position key selector normally closed · SS IEC selector-switch contact: 4 stable positions key selector normally open · SS IEC selector-switch contact: 4 stable positions key selector normally closed · SS IEC selector-switch contact: 4 stable positions key selector normally open-rotating in 2 ways · SS IEC selector-switch contact: 4 stable positions key selector normally closed-rotating in 2 ways · SS IEC selector-switch contact: 4 stable positions key selector normally open-rotating clockwise · SS IEC selector-switch contact: 4 stable positions key selector normally closed-rotating clockwise · SS IEC protective circuit-breaker form: with current protection · CB IEC protective circuit-breaker form: with max. current and min. voltage protection · CB IEC protective circuit-breaker form: with max. thermal/current and min. voltage protection · CB IEC protective circuit-breaker form: with max. thermal and min. voltage protection · CB IEC protective circuit-breaker form: with max. thermal and current protection · CB IEC protective circuit-breaker form: with max. thermal protection and differential · CB IEC protective circuit-breaker form: 1 pole auto switch with magneto · CB IEC protective circuit-breaker form: 1 pole auto magneto-thermal switch/disconnect · CB IEC fused switching form: 1 phase disconnect with fuse · QS IEC fused switching form: 1 phase maneuver switch/disconnect with fuse · QS IEC fused switching form: maneuver switch with fuse · QS IEC fused switching form: power auto switch/disconnect · QS IEC timing-relay form: on/off delay · KT IEC timing-relay form: 3 clamp delay relay - energized · KT IEC timing-relay form: 3 clamp delay relay - de-energized · KT IEC timing-relay form: normally open contact (instant) · KT IEC timing-relay form: normally closed contact (instant) · KT IEC timing-relay form: normally open delay on/off · KT IEC timing-relay form: normally closed delay on/off · KT IEC motor-starter form: motor starter coil · KM IEC motor-starter form: motor starter 1 pole normally open (power) · KM IEC motor-starter form: motor starter 1 pole normally closed (power) · KM IEC mechanical position-switch contact: limit switch, roller normally closed · LS IEC mechanical position-switch contact: limit switch normally closed - cam driven · LS IEC mechanical position-switch contact: limit switch normally open - events driven · LS IEC mechanical position-switch contact: limit switch normally closed - events driven · LS IEC mechanical position-switch contact: 2 position switch normally open with detents and lamp · LS IEC mechanical position-switch contact: 2 position switch normally closed with detents and lamp · LS IEC mechanical position-switch contact: bi-directional lever actuated - normally open · LS IEC mechanical position-switch contact: bi-directional lever actuated - normally closed · LS IEC mechanical position-switch contact: four-directional lever actuated - normally open · LS IEC mechanical position-switch contact: four-directional lever actuated - normally closed · LS IEC mechanical position-switch contact: bi-directional lever actuated - normally open with detent · LS IEC mechanical position-switch contact: bi-directional lever actuated - normally closed with detent · LS IEC mechanical position-switch contact: four-directional lever actuated - normally open with detent · LS IEC mechanical position-switch contact: four-directional lever actuated - normally closed with detent · LS IEC inductive proximity sensor: ferrous proximity switch, normally open · IND IEC inductive proximity sensor: ferrous proximity switch, normally closed · IND IEC inductive proximity sensor: normally closed 3 wire · IND IEC inductive proximity sensor: normally open 3 wire with connector · IND IEC inductive proximity sensor: normally closed 3 wire with connector · IND IEC capacitive proximity sensor: capacitive switch, normally open · CAP IEC capacitive proximity sensor: capacitive switch, normally closed · CAP IEC capacitive proximity sensor: normally open 3 wire · CAP IEC capacitive proximity sensor: normally closed 3 wire · CAP IEC capacitive proximity sensor: normally open 3 wire with connector · CAP IEC capacitive proximity sensor: normally closed 3 wire with connector · CAP IEC magnetic proximity sensor: magnetic proximity switch, normally open · MAG IEC magnetic proximity sensor: magnetic proximity switch, normally closed · MAG IEC magnetic proximity sensor: normally open 3 wire · MAG IEC magnetic proximity sensor: normally closed 3 wire · MAG IEC magnetic proximity sensor: normally open 3 wire with connector · MAG IEC magnetic proximity sensor: normally closed 3 wire with connector · MAG IEC photoelectric emitter interface: emitter - AC driven · TX IEC photoelectric emitter interface: emitter - DC driven · TX IEC photoelectric emitter interface: emitter - receiver with form c · TX IEC photoelectric emitter interface: normally open 4 wire · TX IEC photoelectric emitter interface: normally closed 4 wire · TX IEC photoelectric emitter interface: normally open 4 wire with connector · TX IEC photoelectric emitter interface: normally closed 4 wire with connector · TX IEC photoelectric receiver: normally open receiver 2 wire · RX IEC photoelectric receiver: normally closed receiver 2 wire · RX IEC photoelectric receiver: normally open receiver 2 wire with connector · RX IEC photoelectric receiver: normally closed receiver 2 wire with connector · RX IEC photoelectric receiver: normally open receiver 3 wire · RX IEC photoelectric receiver: normally closed receiver 3 wire · RX IEC photoelectric receiver: normally open receiver 3 wire with connector · RX IEC photoelectric receiver: normally closed receiver 3 wire with connector · RX IEC photoelectric receiver: normally open receiver - AC driven · RX IEC photoelectric receiver: normally closed receiver - AC driven · RX IEC photoelectric receiver: normally open receiver - DC driven · RX IEC photoelectric receiver: normally closed receiver - DC driven · RX IEC combined photoelectric sensor: normally closed emitter-receiver - DC driven · TX IEC combined photoelectric sensor: normally open emitter-receiver AC/DC driven 2 pin · TX IEC combined photoelectric sensor: normally closed emitter-receiver AC/DC driven 2 pin · TX IEC combined photoelectric sensor: normally open emitter-receiver AC driven 3 pin · TX IEC combined photoelectric sensor: normally closed emitter-receiver AC driven 3 pin · TX IEC combined photoelectric sensor: normally open emitter-receiver DC driven 3 pin · TX IEC combined photoelectric sensor: normally closed emitter-receiver DC driven 3 pin · TX IEC combined photoelectric sensor: normally open emitter-receiver AC driven 4 pin · TX IEC combined photoelectric sensor: normally closed emitter-receiver AC driven 4 pin · TX IEC combined photoelectric sensor: normally open emitter-receiver DC driven 4 pin · TX IEC combined photoelectric sensor: normally closed emitter-receiver DC driven 4 pin · TX IEC combined photoelectric sensor: form c emitter-receiver AC driven 5 pin · TX IEC combined photoelectric sensor: form c emitter-receiver DC driven 5 pin · TX IEC ultrasonic proximity sensor: normally open 3 wire with connector · US IEC ultrasonic proximity sensor: normally closed 3 wire with connector · US IEC touch-sensitive sensor: normally open 3 wire with connector · TOUCH IEC touch-sensitive sensor: normally closed 3 wire with connector · TOUCH IEC PNP phototransistor: photosensitive pnp transistor · PNP PHOTO IEC backward diode: backward (unitunnel) diode · BACKWARD IEC tunnel diode: tunnel diode · TUNNEL IEC two-wire PLC point: in, 1st point, 2 wires · PLC IEC two-wire PLC point: out, 1st point, 2 wires · PLC ANSI/IEEE Residual-current breaker with overcurrent protection form · RCBO ANSI/IEEE Three-position disconnector form · DS 3POS ANSI/IEEE Semiconductor power switch form · SSW ANSI/IEEE Unidirectional semiconductor power switch form · SSW UNI ANSI/IEEE Two-pole power switch form · SW 2P ANSI/IEEE Three-phase star autotransformer form · AT 3PH Y ANSI/IEEE Star-delta transformer form · TX Y-D ANSI/IEEE Delta-star transformer form · TX D-Y ANSI/IEEE Delta-delta transformer form · TX D-D ANSI/IEEE Star-star transformer form · TX Y-Y ANSI/IEEE Star-zigzag transformer form · TX Y-Z ANSI/IEEE Star-star-delta three-winding transformer form · TX Y-Y-D ANSI/IEEE Solid-state relay form · SSR ANSI/IEEE High-speed relay form · K FAST ANSI/IEEE Measuring relay form · K MEAS ANSI/IEEE Relay coil with diode and LED form · K D LED ANSI/IEEE Relay coil with capacitor suppression form · K CAP ANSI/IEEE Counter relay with manual reset form · COUNT MAN ANSI/IEEE Counter relay with electrical reset form · COUNT ELEC ANSI/IEEE Non-resettable counter relay form · COUNT TOTAL ANSI/IEEE Manually unlatched NO contact form · NO UNLATCH ANSI/IEEE Manually unlatched NC contact form · NC UNLATCH ANSI/IEEE Make-before-break changeover contact form · MBB ANSI/IEEE Key-operated normally-open switch form · KEY NO ANSI/IEEE Key-operated normally-closed switch form · KEY NC ANSI/IEEE Latched key-operated switch form · KEY HOLD ANSI/IEEE Pull-cord switch form · PULL CORD ANSI/IEEE Foot-operated switch form · FOOT ANSI/IEEE Lever-operated switch form · LEVER ANSI/IEEE Three-position selector returning from left form · SEL 3 LRET ANSI/IEEE Three-position selector returning from right form · SEL 3 RRET ANSI/IEEE Cam-operated limit switch form · LS CAM ANSI/IEEE Self-operating thermal switch form · TS SELF ANSI/IEEE Gas flow switch form · FS GAS ANSI/IEEE Inductive proximity switch form · PROX IND ANSI/IEEE Three-wire inductive proximity switch form · PROX IND 3W ANSI/IEEE Capacitive proximity switch form · PROX CAP ANSI/IEEE Magnetic proximity switch form · PROX MAG ANSI/IEEE Photoelectric emitter-receiver switch form · PHOTO ANSI/IEEE Maximum-current monitoring relay form · I HIGH ANSI/IEEE Minimum-current monitoring relay form · I LOW ANSI/IEEE Current window monitoring relay form · I WINDOW ANSI/IEEE Differential-current measuring relay form · I DIFF ANSI/IEEE Residual-voltage monitoring relay form · U RES ANSI/IEEE Loss-of-voltage monitoring relay form · U LOSS ANSI/IEEE Phase-loss monitoring relay form · PH LOSS ANSI/IEEE Frequency monitoring relay form · f MON ANSI/IEEE Minimum active-power relay form · P LOW ANSI/IEEE RC network form · RC ANSI/IEEE Three-phase power-factor capacitor form · CAP 3PH ANSI/IEEE DIAC form · DIAC ANSI/IEEE Three-phase bridge rectifier form · BR 3PH ANSI/IEEE Bidirectional breakdown diode form · TVS BI ANSI/IEEE Single-phase motor with fan form · M 1PH FAN ANSI/IEEE Three-phase motor with fan form · M 3PH FAN ANSI/IEEE Three-phase synchronous motor form · M 3PH SYNC ANSI/IEEE Series-excited DC motor form · M DC SERIES ANSI/IEEE Separately excited DC motor form · M DC SEP ANSI/IEEE Single-phase AC source form · AC 1PH ANSI/IEEE Three-phase AC source form · AC 3PH ANSI/IEEE Photovoltaic generator form · PV GEN ANSI/IEEE Solar generating station form · SOLAR STN ANSI/IEEE Wind generating station form · WIND STN ANSI/IEEE Substation form · SUBSTATION ANSI/IEEE Converter substation form · CONV STN ANSI/IEEE Two-phase winding connection form · Q060201 ANSI/IEEE Partial-V winding connection form · Q060202 ANSI/IEEE Four-phase winding with accessible connection form · Q060203 ANSI/IEEE Three-phase T winding connection form · Q060204 ANSI/IEEE Six-phase double-delta winding connection form · Q060210 ANSI/IEEE Six-phase polygon winding connection form · Q060211 ANSI/IEEE Six-phase star winding connection form · Q060212 ANSI/IEEE Six-phase double-zigzag winding connection form · Q060213 ANSI/IEEE Automatic mechanical-return indication form · Q021207 ANSI/IEEE Mechanical stop-latch indication form · Q021208 ANSI/IEEE Mechanical stop latch in neutral state form · Q021209 ANSI/IEEE Mechanical stop latch in engaged state form · Q021210 ANSI/IEEE Mechanical interlock between devices form · Q021211 ANSI/IEEE Manually released latching device form · Q1020604 ANSI/IEEE Mechanical clutch connection form · Q021216 ANSI/IEEE Disconnected mechanical coupling form · Q021217 ANSI/IEEE Engaged mechanical coupling form · Q021218 ANSI/IEEE Mechanical gear connection form · Q021223 ANSI/IEEE Clock indication form · HIN1P29 ANSI/IEEE Minute-pulse clock contact form · HIN1P33 ANSI/IEEE Audible bell form · HAN1B ANSI/IEEE Audible buzzer form · HAN1Z ANSI/IEEE Audible siren form · HAN1S ANSI/IEEE Loudspeaker annunciation form · HAN1B7 ANSI/IEEE Combined loudspeaker and microphone form · HAN1B8 ANSI/IEEE Microphone input form · HAN1B9 ANSI/IEEE Solenoid valve actuator form · HSV1 ANSI/IEEE Solenoid closing function for an open valve form · HSV1Y1 ANSI/IEEE Electromagnetic brake actuator form · HSV1Y4 ANSI/IEEE Solenoid-valve NO auxiliary contact form · HSV21 ANSI/IEEE Solenoid-valve NC auxiliary contact form · HSV22 ANSI/IEEE Ultrasonic proximity switch form · HPX1U ANSI/IEEE Ultrasonic NO switching output form · HPX11U ANSI/IEEE Ultrasonic NC switching output form · HPX12U ANSI/IEEE Three-wire ultrasonic sensor form · HPX11U3 ANSI/IEEE Touch-sensitive switch form · HPX1TS ANSI/IEEE Touch-switch NO output form · HPX11TS ANSI/IEEE Touch-switch NC output form · HPX12TS ANSI/IEEE Three-wire touch-sensitive switch form · HPX11TS3 ANSI/IEEE Phase-to-phase voltmeter selector form · HSW1S90 ANSI/IEEE Phase-to-neutral voltmeter selector form · HSW1S91 ANSI/IEEE Combined line and phase voltmeter selector form · HSW1S92 ANSI/IEEE Two-network voltage measurement selector form · HSW1S93 ANSI/IEEE Three-point current measurement selector form · HSW1S94 ANSI/IEEE Four-point current measurement selector form · HSW1S95 ANSI/IEEE Latched pull-cord switch form · HPC11L ANSI/IEEE Latched foot-operated switch form · HFT11L ANSI/IEEE Latched lever-operated switch form · HPB11LSL ANSI/IEEE Three-phase motor with four connections form · HMO14 ANSI/IEEE Three-phase induction motor with series excitation form · HMO1M3 ANSI/IEEE Star-stator wound-rotor motor with rotor starter form · HMO1M5 ANSI/IEEE Six-pole asynchronous motor form · HMO1M11 ANSI/IEEE Single-phase series-connected AC motor form · HMO1M10 ANSI/IEEE Single-phase synchronous motor form · HMO1M16 ANSI/IEEE Permanent-magnet linear DC motor form · HMO1M14 ANSI/IEEE Permanent-magnet stepping motor form · HMO1M15 ANSI/IEEE Shunt-excited DC motor form · HMO1M8 ANSI/IEEE Resistor with disconnecting slider form · HVR1R5 ANSI/IEEE Carbon-disc variable resistor form · HVR1R8 ANSI/IEEE Magnetoresistive element form · HVR1S00689 ANSI/IEEE Differential capacitor form · HCA1_S00573 ANSI/IEEE Dy5 transformer connection reference form · Dy5 ANSI/IEEE Dd6 transformer connection reference form · Dd6 ANSI/IEEE Yd5 transformer connection reference form · Yd5 ANSI/IEEE Yy6 transformer connection reference form · Yy6 ANSI/IEEE Yd11 transformer connection reference form · Yd11 ANSI/IEEE Dy11 transformer connection reference form · Dy11 ANSI/IEEE Dz0 transformer connection reference form · Dz0 ANSI/IEEE Yz5 transformer connection reference form · Yz5 ANSI/IEEE Dz6 transformer connection reference form · Dz6 ANSI/IEEE Yz11 transformer connection reference form · Yz11 ANSI/IEEE Neutral link, closed form · N ANSI/IEEE Neutral link, open form · N ANSI/IEEE Double spark gap form · F ANSI/IEEE Symmetric gas discharge tube form · F ANSI/IEEE Reverse-current measuring relay form · K ANSI/IEEE Percentage-biased differential current relay form · K ANSI/IEEE Neutral-current measuring relay form · K ANSI/IEEE Neutral-unbalance relay between two polyphase systems form · K ANSI/IEEE Earth-fault current relay form · K ANSI/IEEE Minimum-voltage measuring relay form · K ANSI/IEEE Maximum-voltage measuring relay form · K ANSI/IEEE Earth-fault voltage relay form · K ANSI/IEEE Minimum-impedance measuring relay form · K ANSI/IEEE Insulation monitoring relay form · IMD Synchronism check · 25 Undervoltage · 27 Directional power · 32 Current unbalance / negative sequence · 46 Thermal protection · 49 Instantaneous overcurrent · 50 Time overcurrent · 51 AC circuit breaker · 52 Overvoltage · 59 Directional overcurrent · 67 AC autoreclosing · 79 Frequency protection · 81 Lockout · 86 Differential protection · 87 Line switch · 89 Master element · 1 Time-delay starting or closing relay · 2 Checking or interlocking relay · 3 Master contactor · 4 Stopping device · 5 Starting circuit breaker · 6 Rate-of-change relay · 7 Control power disconnecting device · 8 Reversing device · 9 Unit sequence switch · 10 Multifunction device · 11 Overspeed device · 12 Synchronous-speed device · 13 Underspeed device · 14 Speed or frequency matching device · 15 Data communications device · 16 Shunting or discharge switch · 17 Accelerating or decelerating device · 18 Starting-to-running transition contactor · 19 Electrically operated valve · 20 Distance protection · 21 Equalizer circuit breaker · 22 Temperature control device · 23 Overexcitation protection · 24 Apparatus thermal device · 26 Flame detector · 28 Isolating contactor · 29 Annunciator relay · 30 Separate excitation device · 31 Position switch · 33 Master sequence device · 34 Brush-operating or slip-ring short-circuiting device · 35 Polarity device · 36 Undercurrent or underpower protection · 37 Bearing protective device · 38 Mechanical condition monitor · 39 Field or loss-of-excitation protection · 40 Field circuit breaker · 41 Running circuit breaker · 42 Manual transfer or selector device · 43 Unit sequence starting relay · 44 Atmospheric condition monitor · 45 Phase-sequence or voltage-balance protection · 47 Incomplete-sequence relay · 48 Exciter or DC generator relay · 53 Turning-gear engaging device · 54 Power factor protection · 55 Field application relay · 56 Short-circuiting or grounding device · 57 Rectification failure relay · 58 Voltage or current balance relay · 60 Density switch or sensor · 61 Time-delay stopping or opening relay · 62 Pressure switch or relay · 63 Ground detector protection · 64 Governor · 65 Notching or jogging device · 66 Blocking or out-of-step supervision · 68 Permissive control device · 69 Rheostat · 70 Level switch or relay · 71 DC circuit breaker · 72 Load-resistor contactor · 73 Alarm relay · 74 Position-changing mechanism · 75 DC overcurrent relay · 76 Telemetering device · 77 Phase-angle or out-of-step protection · 78 Flow switch or relay · 80 DC load-measuring reclosing relay · 82 Automatic selective control or transfer relay · 83 Operating mechanism · 84 Pilot or carrier receiver relay · 85 Auxiliary motor or motor-generator · 88 Regulating device · 90 Voltage directional relay · 91 Voltage and power directional relay · 92 Field-changing contactor · 93 Tripping or trip-free relay · 94 Phase distance protection · 21P Ground distance protection · 21G Admittance-based earth-fault protection · 21YN Auxiliary-input undervoltage protection · 27A Main-input undervoltage protection · 27M Reactive-power undervoltage protection · 27Q Low-voltage ride-through supervision · 27T Wattmetric earth-fault protection · 32N Directional reactive-power protection · 32V Reverse-power protection · 32R Underpower protection · 32U Generator current-unbalance protection · 46G Phase-discontinuity protection · 46PD RTD-based thermal protection · 49R Motor thermal-model protection · 49M Instantaneous phase overcurrent · 50P Instantaneous neutral overcurrent · 50N Instantaneous ground overcurrent · 50G Instantaneous negative-sequence overcurrent · 50Q Calculated residual instantaneous overcurrent · 50R Measured ground instantaneous overcurrent · 50X Circuit-breaker failure protection · 50BF Motor jam or stall protection · 50J Time phase-overcurrent protection · 51P Time neutral-overcurrent protection · 51N Time ground-overcurrent protection · 51G Time negative-sequence overcurrent · 51Q Calculated residual time-overcurrent · 51R Measured ground time-overcurrent · 51X Voltage-dependent overcurrent · 51V Apparent power-factor supervision · 55A Displacement power-factor supervision · 55D Residual or neutral overvoltage · 59N Negative-sequence overvoltage · 59Q Auxiliary-input overvoltage · 59A Main-input overvoltage · 59M Field ground-fault protection · 64F Stator ground-fault protection · 64G Directional phase-overcurrent · 67P Directional neutral-overcurrent · 67N Directional ground-overcurrent · 67G Directional negative-sequence overcurrent · 67Q Calculated residual directional overcurrent · 67R Measured ground directional overcurrent · 67X Multifrequency admittance earth-fault protection · 67YN Transient or intermittent earth-fault protection · 67NIEF Trip-coil monitoring · 74TCM Voltage vector-shift protection · 78VS Underfrequency protection · 81U Overfrequency protection · 81O Rate-of-change-of-frequency protection · 81R Transformer differential protection · 87T Busbar differential protection · 87B Generator differential protection · 87G Motor differential protection · 87M Line current differential protection · 87L Neutral differential protection · 87N Negative-sequence differential protection · 87Q Restrained current differential protection · 87R Unrestrained high-set differential protection · 87H Restricted ground differential protection · 87GD Switchgear panel · Panel Switchboard · Board Ring main unit · RMU Transformer envelope · Transformer GA Battery storage cabinet · BESS cabinet Power conversion cabinet · PCS cabinet Generator package · Genset GA Transfer-switch assembly · ATS Control / marshalling cabinet · Control GA Cable ladder / tray · Cable support Busbar trunking · Busway Mounting plate · Plate Terminal strip assembly · Terminal strip Air circuit breaker · ACB Moulded-case circuit breaker · MCCB Miniature circuit breaker · MCB Residual-current circuit breaker · RCCB Residual-current breaker with overcurrent protection · RCBO DC circuit breaker · GA Motor-protection circuit breaker · MPCB Switch disconnector · GA Fuse-switch disconnector · GA Fuse holder · GA Power contactor · GA Reversing contactor assembly · GA Star-delta starter assembly · GA Thermal overload relay · GA Electronic motor overload relay · GA Soft starter · GA Variable-frequency drive · VFD Drive braking resistor · GA AC line reactor · GA Control transformer · GA Dry-type transformer enclosure · GA Oil-filled transformer installation · GA Neutral earthing resistor cabinet · NER Power-factor-correction capacitor bank · GA Active harmonic filter cabinet · GA Surge protective device assembly · SPD DIN-rail AC/DC power supply · GA DIN-rail DC/DC converter · DC DC redundancy module · GA DC buffer module · GA DC UPS module · GA Battery charger · DC AC UPS cabinet · GA UPS maintenance bypass panel · GA Station DC battery rack · GA PLC CPU module · GA PLC power module · GA Digital input module · GA Digital output module · GA Analogue input module · GA Analogue output module · GA Remote I/O station · GA HMI touchscreen · GA Industrial panel PC · GA Industrial Ethernet switch · GA Industrial VPN router · GA Fibre-optic patch panel · GA Communication gateway · GA Interface relay module · GA Relay socket · GA Timer relay · GA Safety relay module · GA Signal conditioner · GA Terminal marshalling interface · GA Feed-through terminal block · GA Protective-earth terminal block · GA Multi-level terminal block · GA Fuse terminal block · GA Disconnect terminal block · GA CT shorting test terminal · GA Distribution terminal block · GA Pluggable terminal connector · GA Terminal end stop · GA Terminal marker strip · GA DIN mounting rail · GA Slotted wiring duct · GA Cable gland · GA Cable-entry frame · GA Bulkhead connector · GA Cable cleat · GA Perforated cable tray · GA Wire-mesh cable basket · GA Cable-tray horizontal bend · GA Cable-tray vertical riser · GA Cable support bracket · GA Cable trench · GA Cable pit · GA Cable duct bank · GA Earth bar · GA Neutral bar · GA Flexible busbar connection · GA Rigid busbar assembly · GA Busbar support insulator · GA Busway tap-off unit · GA LV incomer compartment · GA LV feeder compartment · GA Bus-coupler compartment · GA Cable termination compartment · GA Busbar compartment · GA Metering compartment · GA Motor control centre lineup · GA Withdrawable motor feeder unit · GA MV vacuum circuit-breaker truck · GA Switchgear arc exhaust plenum · GA Protection relay panel · GA Panel power meter · GA Energy submeter · GA Window current transformer · GA Split-core current transformer · GA Voltage transformer assembly · VT Wall-mounted junction enclosure · GA Floor-standing enclosure · GA Enclosure plinth · GA Enclosure gland plate · GA Enclosure door swing envelope · GA Equipment maintenance envelope · GA Equipment removal route · GA Switchroom egress path · GA Enclosure anti-condensation heater · GA Enclosure thermostat · GA Enclosure hygrostat · GA Enclosure filter fan · GA Enclosure air conditioner · GA Enclosure air-to-air heat exchanger · GA Switchroom supply fan · GA Switchroom exhaust fan · GA Ventilation intake louver · GA Motorised ventilation damper · GA Backdraft damper · GA Fire damper · GA Smoke-control damper · GA Generator day tank · GA Generator bulk fuel tank · GA Generator fuel transfer pump · GA Generator fuel bund · GA Generator exhaust silencer · GA Generator exhaust flexible connection · GA Generator exhaust stack · GA Generator radiator discharge duct · GA Generator remote radiator · GA Generator vibration isolator · GA Generator acoustic canopy · GA Generator coolant heater · GA Generator starting battery · GA Generator paralleling controller · GA PV string combiner box · GA PV inverter cabinet · GA PV DC isolator enclosure · GA MPPT solar charge controller · GA Battery inverter-charger · GA Battery management system module · BMS Battery DC disconnect assembly · GA Battery precharge assembly · DC Battery DC bus distribution module · DC Battery current shunt · DC Energy-management controller · EMS Outdoor energy-storage container · GA Battery cooling unit · GA Battery fire-system interface panel · GA Smoke detector installation point · GA Fire alarm control panel location · GA Emergency stop station · GA Pilot-light station · GA Selector-switch station · GA Trapped-key interlock assembly · GA Door-mounted pushbutton enclosure · GA Panel service outlet · GA Panel inspection lighting · GA AutomationDirect BRX Series PLC · BRX Series PLC AutomationDirect CLICK PLCs · CLICK PLCs AutomationDirect Productivity1000 PAC · Productivity1000 PAC AutomationDirect Productivity2000 PAC · Productivity2000 PAC AutomationDirect Productivity3000 PAC · Productivity3000 PAC AutomationDirect Terminator Field I/O · Terminator Field I/O AutomationDirect Protos X Field I/O · Protos X Field I/O AutomationDirect ZIPLinks · ZIPLinks AutomationDirect DINnectors · DINnectors AutomationDirect Konnect-It DIN-rail terminals · Konnect-It DIN-rail terminals AutomationDirect C-more Panels · C-more Panels AutomationDirect C-more Micro Graphic Panels · C-more Micro Graphic Panels AutomationDirect GS and DURApulse AC drives · GS and DURApulse AC drives AutomationDirect LR Series line reactors · LR Series line reactors AutomationDirect Bimed cable glands · Bimed cable glands AutomationDirect ZIPport Multi-Wire Connectors · ZIPport Multi-Wire Connectors AutomationDirect ZIPport Panel Interface Connectors · ZIPport Panel Interface Connectors AutomationDirect Gladiator CFS disconnects · Gladiator CFS disconnects AutomationDirect WMZT miniature circuit breakers · WMZT miniature circuit breakers AutomationDirect Edison Class T fuses · Edison Class T fuses AutomationDirect Edison Power Distribution Blocks · Edison Power Distribution Blocks AutomationDirect Stride VPN · Stride VPN AutomationDirect AcuAmp · AcuAmp Fuji Electric BM3 manual motor starters · BM3 manual motor starters Fuji Electric SC contactors and thermal overload relays · GA Fuji Electric SC-NEXT contactors · SC-NEXT contactors Fuji Electric Orange Line / Odyssey contactors · Orange Line / Odyssey contactors Fuji Electric Combination starters · Combination starters Fuji Electric G-Twin Lambda circuit breakers · G-Twin Lambda circuit breakers Fuji Electric G-Twin circuit breakers · G-Twin circuit breakers Fuji Electric EA-UL / SA-UL circuit breakers · EA-UL / SA-UL circuit breakers Fuji Electric EG-UL / SG-UL circuit breakers · EG-UL / SG-UL circuit breakers Fuji Electric SK contactors and relays · SK contactors and relays TDK-Lambda D1SE120-xx-A3 · D1SE120-xx-A3 TDK-Lambda D1SE240-xx-A3 · D1SE240-xx-A3 TDK-Lambda D1SE480-xx-A3 · D1SE480-xx-A3 TDK-Lambda DBM20 · DBM20 TDK-Lambda DRB15 · DRB15 TDK-Lambda DRB30 · DRB30 TDK-Lambda DRB480 · DRB480 TDK-Lambda DRF960 · DRF960 TDK-Lambda DRM40 · DRM40 TDK-Lambda DUSH960-1248-1M · DUSH960-1248-1M PULS QS20.241 · QS20.241 Terasaki TemPower AT air circuit breakers · TemPower AT air circuit breakers Terasaki / NHP TemBreak 1 legacy MCCBs · TemBreak 1 legacy MCCBs Schneider Electric MiCOM protection relays · MiCOM protection relays Invertek Drives Optidrive Eco · Optidrive Eco Schneider Electric MasterPact MTZ · MasterPact MTZ Schneider Electric MasterPacT MTZ Active · MasterPacT MTZ Active Schneider Electric ComPacT NSX, new generation · ComPacT NSX, new generation Schneider Electric ComPacT NSXm, new generation · ComPacT NSXm, new generation Schneider Electric ComPacT for DC networks, new generation · ComPacT for DC networks, new generation Schneider Electric Compact INS/INV · Compact INS/INV Schneider Electric Acti9 iC60 · Acti9 iC60 Schneider Electric Acti9 iC60 RCBO · Acti9 iC60 RCBO Schneider Electric PrismaSeT 6300 · PrismaSeT 6300 Schneider Electric PrismaSeT G · PrismaSeT G Schneider Electric TeSys K contactors · TeSys K contactors Schneider Electric TeSys Giga contactors · TeSys Giga contactors Schneider Electric TeSys Deca overload relays · TeSys Deca overload relays Schneider Electric TeSys GV2, LC · TeSys GV2, LC Schneider Electric PowerLogic PM5000 · PowerLogic PM5000 Schneider Electric PowerLogic PM8000 · PowerLogic PM8000 Schneider Electric PowerLogic P5 protection relays · PowerLogic P5 protection relays Schneider Electric PowerLogic PFC Capacitor Banks · PowerLogic PFC Capacitor Banks Schneider Electric PowerLogic T500 Substation Controller · PowerLogic T500 Substation Controller Schneider Electric TransferPacT · TransferPacT ABB MNS switchgear · MNS switchgear ABB ReliaGear SG switchgear · ReliaGear SG switchgear ABB UniGear switchgear · UniGear switchgear Protection relay IED · GA Medium-voltage switchgear lineup · GA Low-voltage switchgear lineup · GA Source-transfer switch assembly · GA Substation RTU · GA Industrial ventilation fan · GA Lithium battery module · GA DIN-rail adapter accessory · GA Combined fire-smoke damper · GA Victron Energy MultiPlus-II · MultiPlus-II Victron Energy Quattro · Quattro Victron Energy SmartSolar MPPT RS · SmartSolar MPPT RS Victron Energy Cerbo GX · Cerbo GX Victron Energy Lynx Distributor · Lynx Distributor Victron Energy Lynx Smart BMS NG · Lynx Smart BMS NG Victron Energy Lithium NG Batteries · Lithium NG Batteries Victron Energy SmartShunt · SmartShunt Victron Energy Skylla-IP65 · Skylla-IP65 Victron Energy Multi RS Solar · Multi RS Solar Victron Energy MultiPlus-II 2x 120V · MultiPlus-II 2x 120V Victron Energy DIN35 adapter · DIN35 adapter DEIF iE 250 controllers · iE 250 controllers Westermo PS2-60 · PS2-60 Westermo Lynx 5612-E-F4G-T8G-LV · Lynx 5612-E-F4G-T8G-LV Dagartech BGPSW 15 ST · BGPSW 15 ST Dagartech DGB 415 ST · DGB 415 ST Greenheck QEI inline fan · QEI inline fan Greenheck QEID inline fan · QEID inline fan Greenheck TBI-FS inline fan · TBI-FS inline fan Greenheck VAB fan · VAB fan Greenheck VAD fan · VAD fan Greenheck USF fan · USF fan Greenheck APH plenum fan · APH plenum fan Greenheck SBE wall fan · SBE wall fan Greenheck SBS wall fan · SBS wall fan Greenheck SE wall fan · SE wall fan Greenheck ESD-435 louver · ESD-435 louver Greenheck ESD-635 louver · ESD-635 louver Greenheck AFL-501 louver · AFL-501 louver Greenheck FSD-311 damper · FSD-311 damper Greenheck FSD-211 damper · FSD-211 damper Greenheck FD-150 damper · FD-150 damper Power cable joint · CABLE JOINT Power quality meter · PQM
kWh/MD Symbols Energy meter with maximum-demand indicator This meter totalises energy and also keeps the maximum average power reached in any demand interval, such as 15 or 30 minutes. Large supplies are often billed partly on that maximum demand, so the meter form appears on the supply single-line diagram with the demand interval stated nearby.
Drawing use SLD / Schematic
Application Metering & protection
Reference family IEC / Manufacturer A distinction that matters A maximum-demand meter records peak averaged power plus energy; a maximum-demand indicator shows only the peak value.
MD Symbols Maximum-demand indicator A maximum-demand indicator shows the highest averaged load reached since it was last reset. Thermal demand ammeters with a drag pointer were common on switchboard feeders and transformer secondaries, and they help assess loading without a full recording instrument.
Drawing use SLD / Schematic
Application Metering & protection
Reference family IEC / Manufacturer A distinction that matters A maximum-demand indicator shows only the peak averaged value; a maximum-demand meter also totalises energy.
Original educational previews. Follow the source references on each full entry for the appropriate standard or selected product.